December 08, 2015
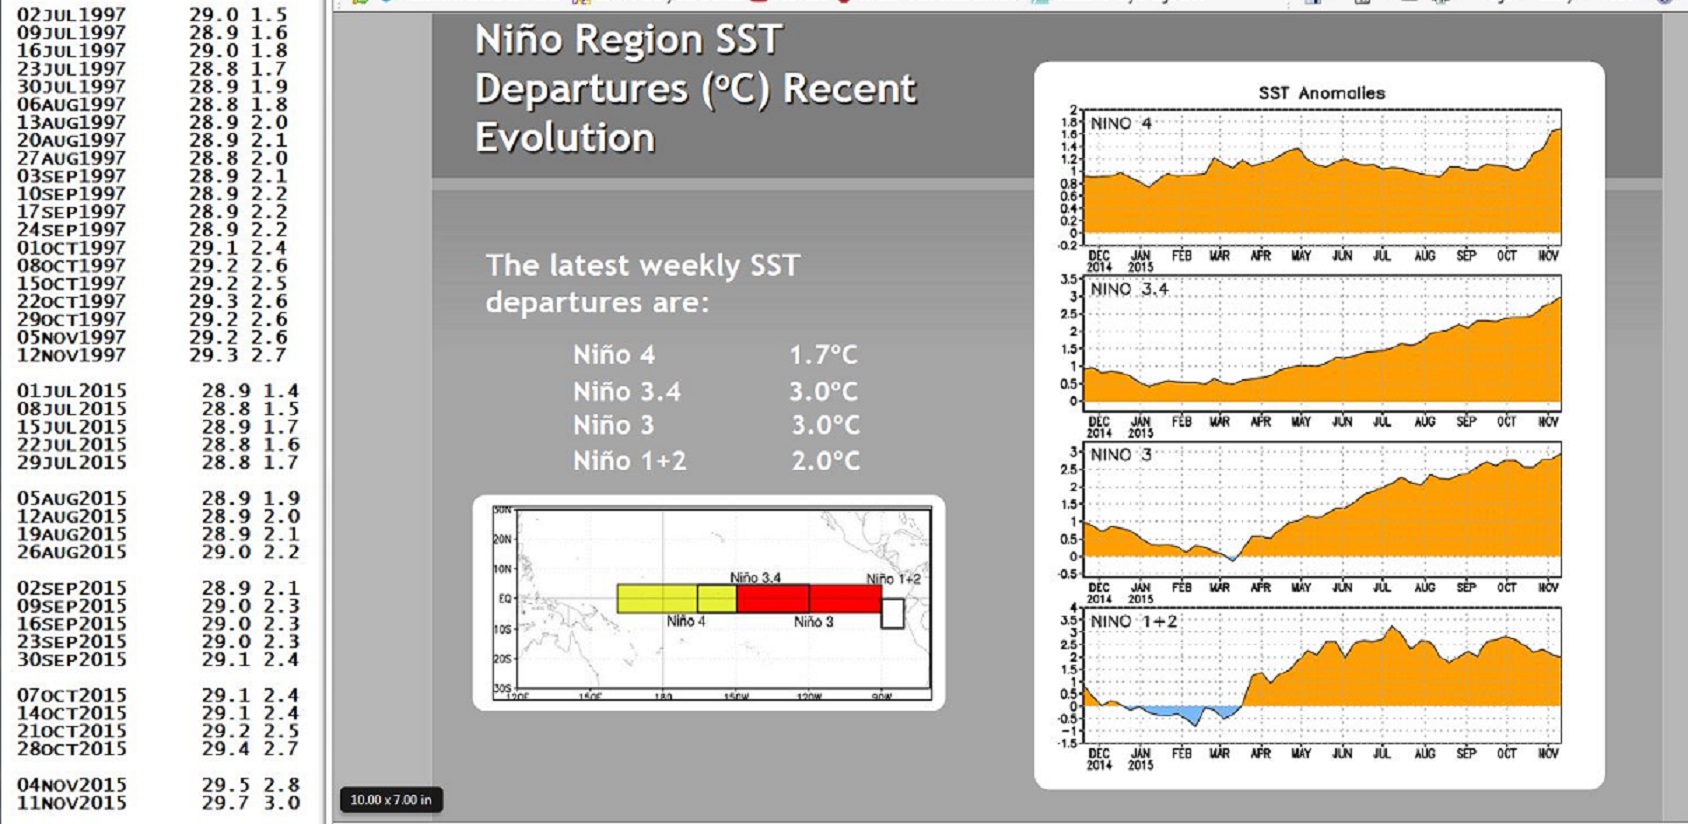
An ONI of +2.0 means El Niño is here, it is happening, and it is happening well into spring.
The book, and the blog, all in anticipation of the possibility of an ONI of +2.0. Everything discussed in the book and covered by Wild Bill’s Blog are a possibility for the winter and spring. Floods, flash floods, tornadoes, wind and winter storms that is, not necessarily 200mph hurricanes. But record events, like Northern England this past weekend. The recent rain broke records set in the last El Niño in 2009.
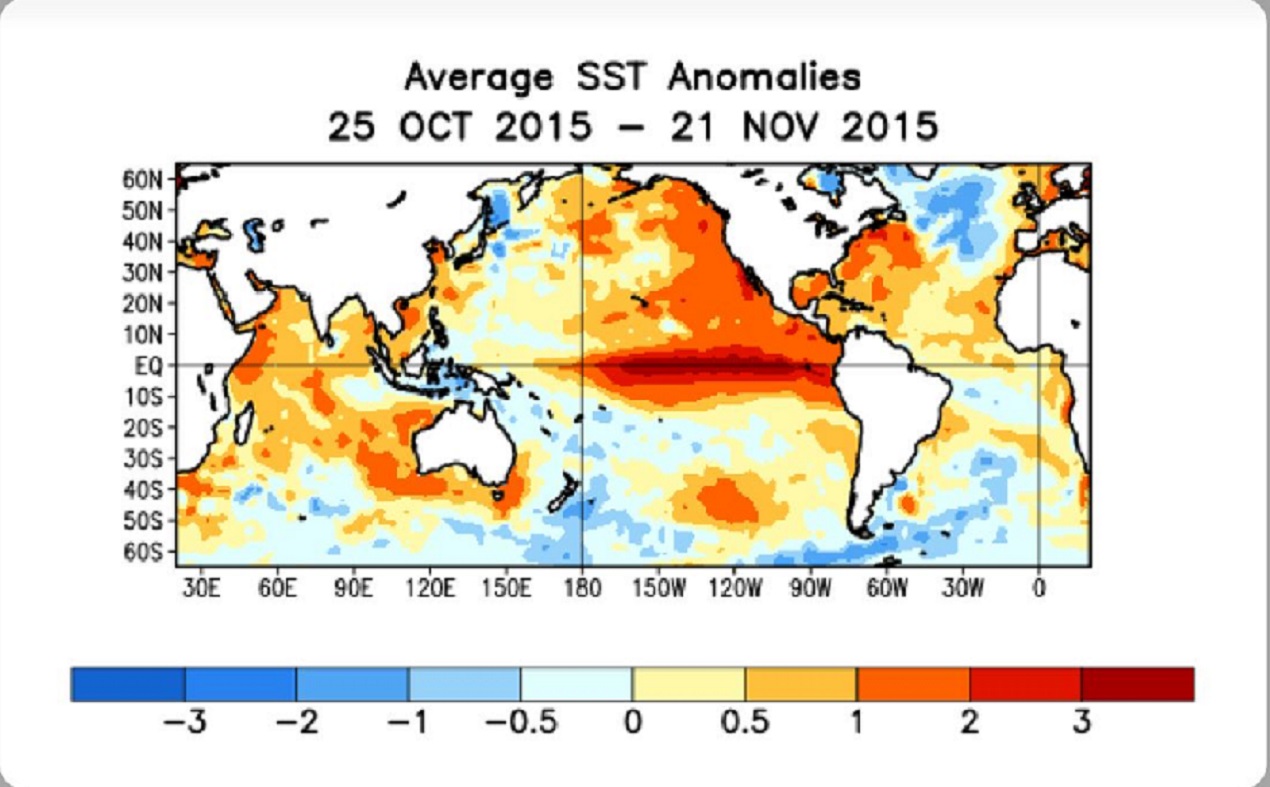
We have followed the weekly anomalies and compared them to 1997 since late September, so this high ONI value is no big surprise. But it does validate the investment in the subject. This is a much longer term average with fancy curve smoothing and high frequency filters. It makes the research scientist happy. Now the event is not just a curiosity, or some weatherman’s whim. It is statistically and mathematically significant. In the world of science math is the foundation, … and Math says this El Niño is significant.
So batten down the hatches and call your neighbor when the weather is on. Use the quiet weather periods to prepare for the bad. Keep watch even when the forecast seems quiet and certain. Some weather patterns are predicable for several days, others change overnight. Overnight surprises could be inches of rain, or inches of snow, maybe from above freezing to below zero or destructive tornadoes.
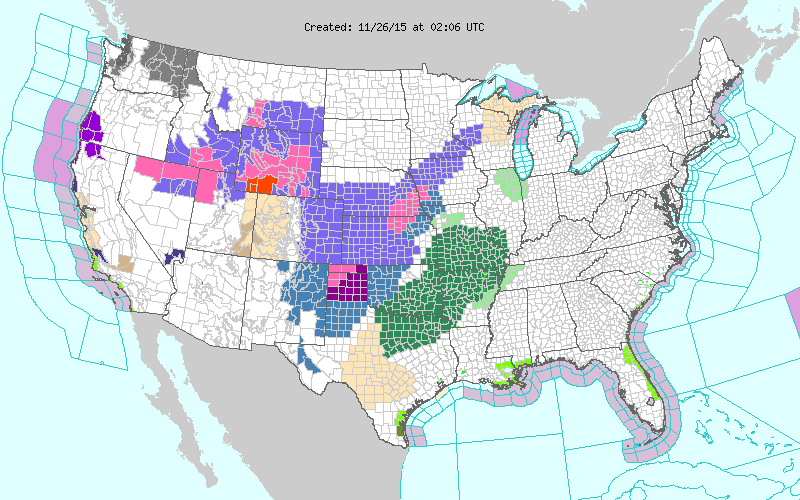
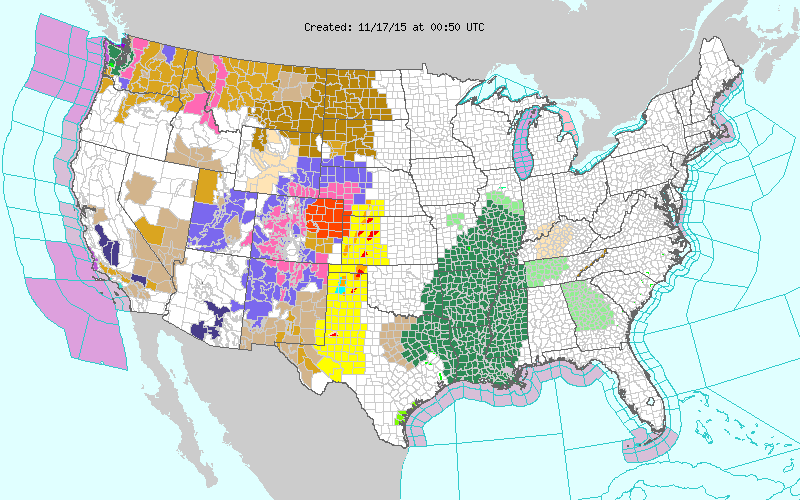
While I would like to say “nothing like that in the current forecast”, but the 10 day outlook actually looks rather eventful. Flooding in parts of the Pacific Northwest next few days, nasty system maybe severe central portions of the country over the weekend, followed by colder temperatures, …. and it all heads east, then repeats much of next week.
And maybe Southern California will see something in the next week or so, …but still waiting for the big Los Angeles storm that says this El Niño is for real.
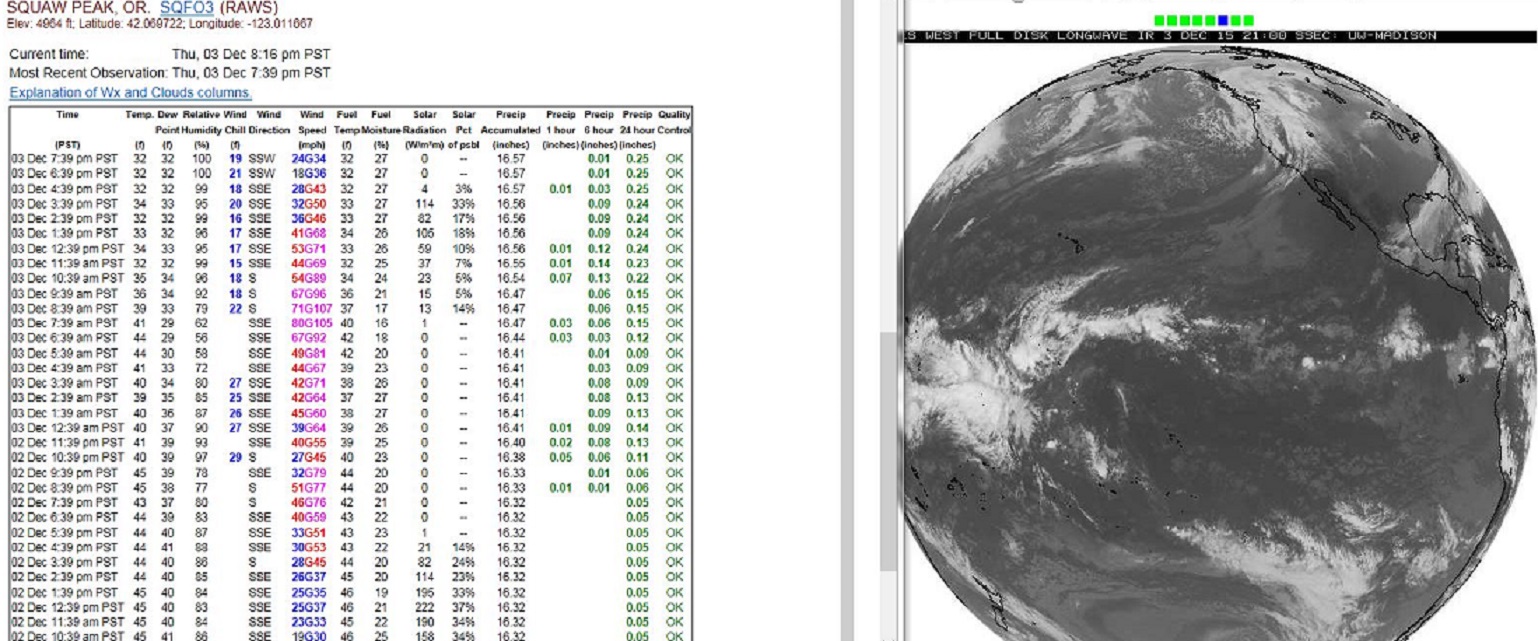
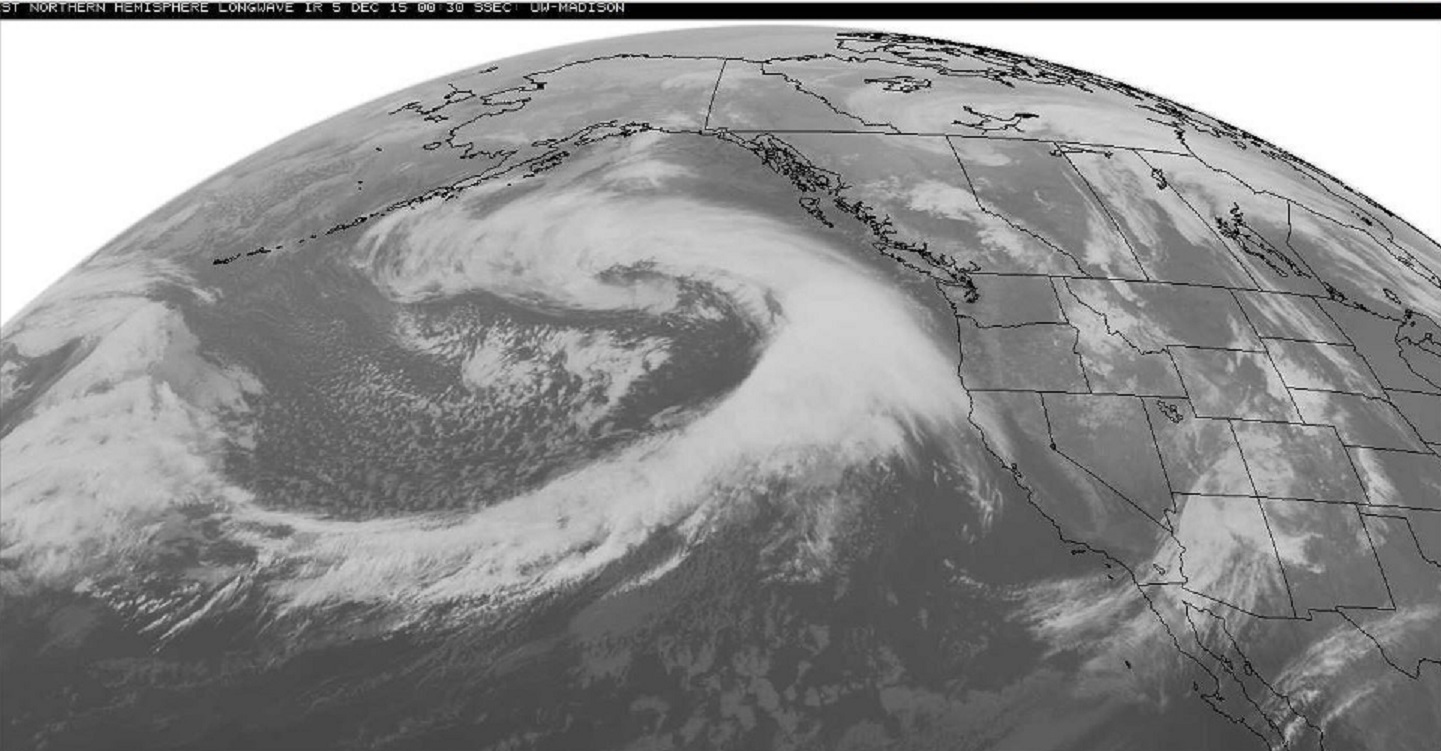
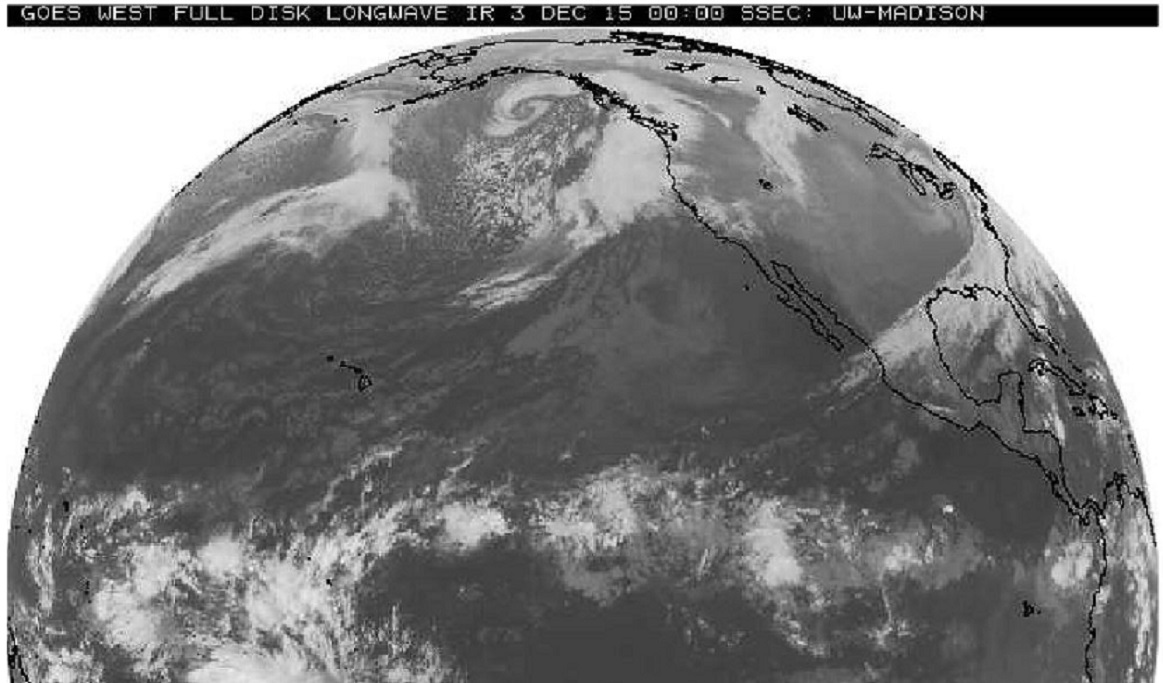
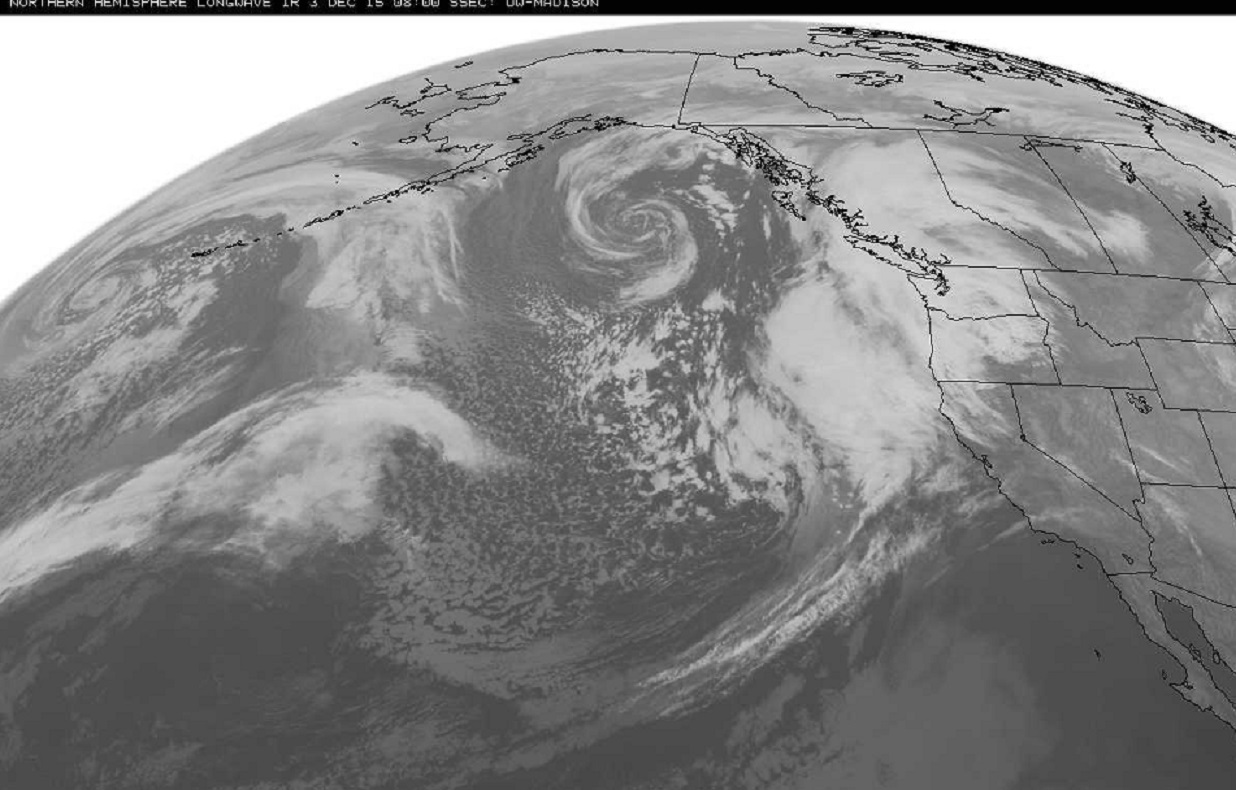
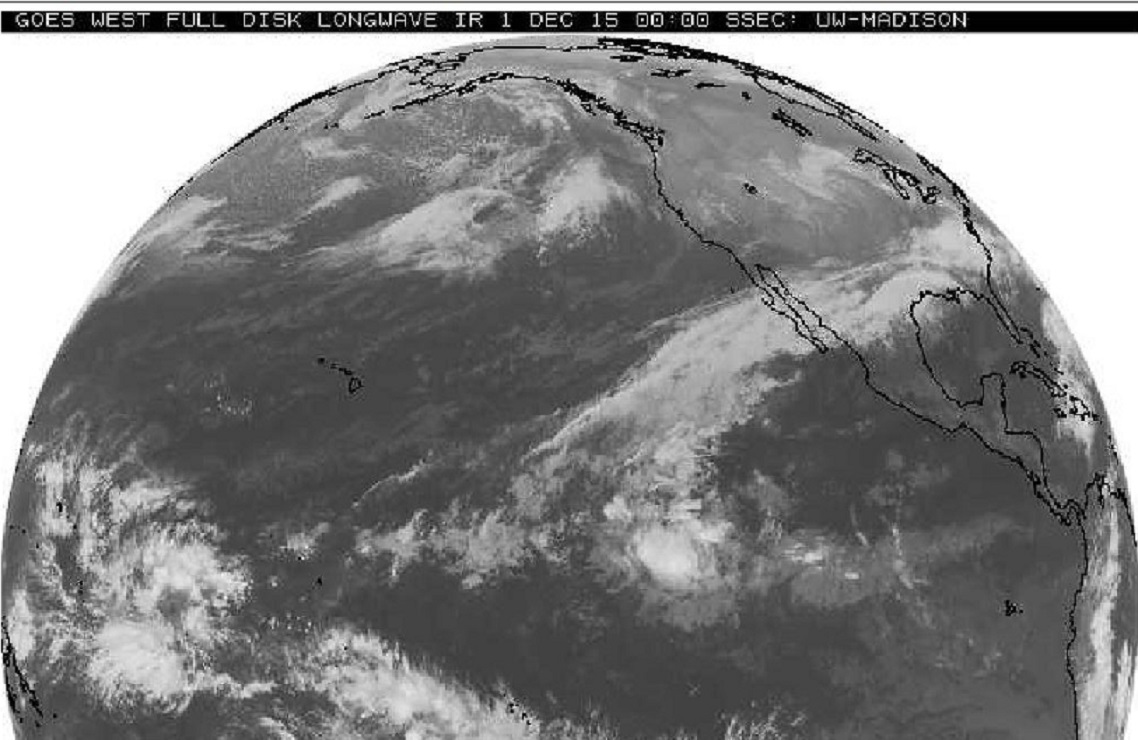
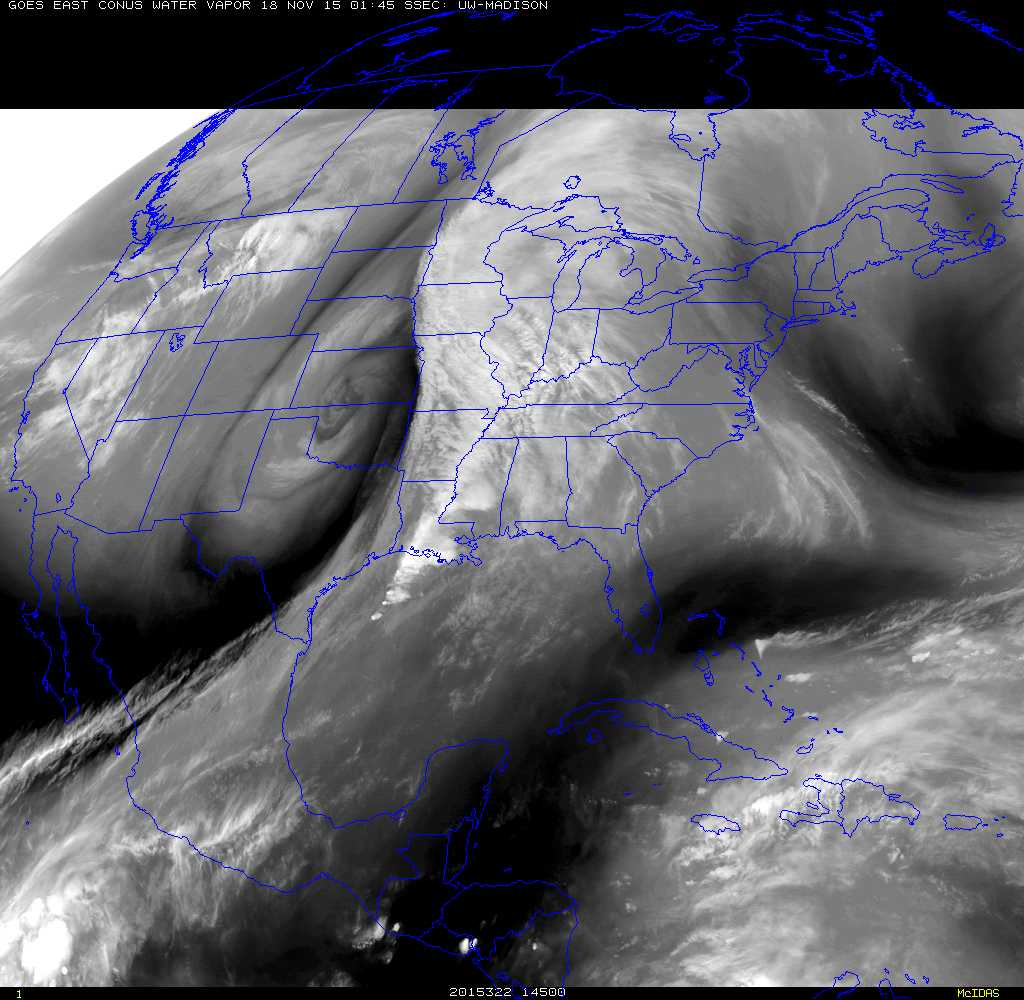
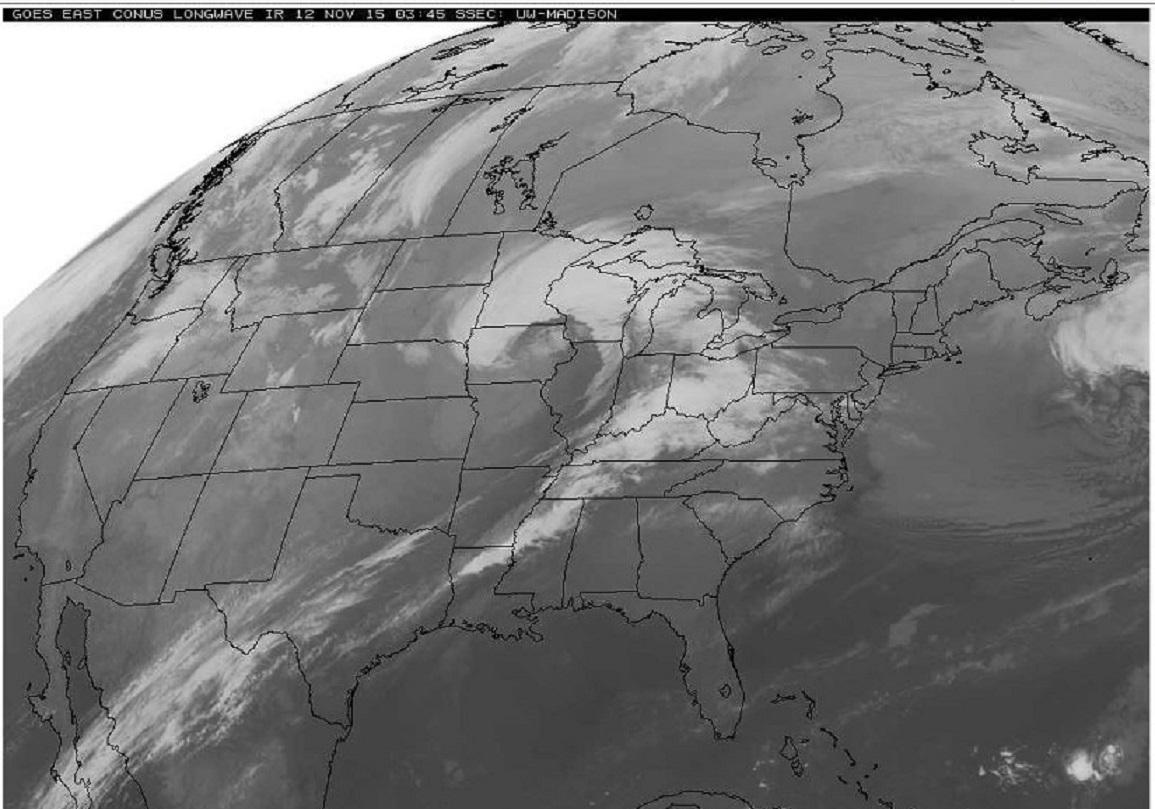
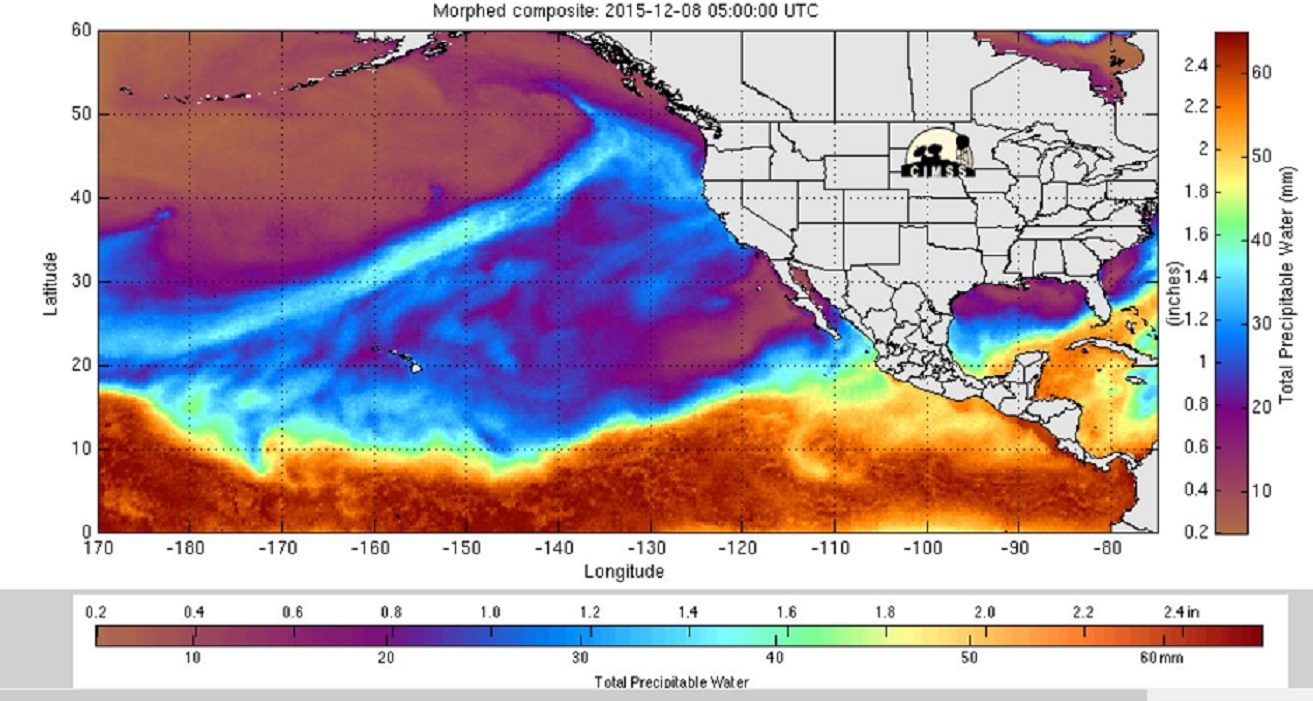
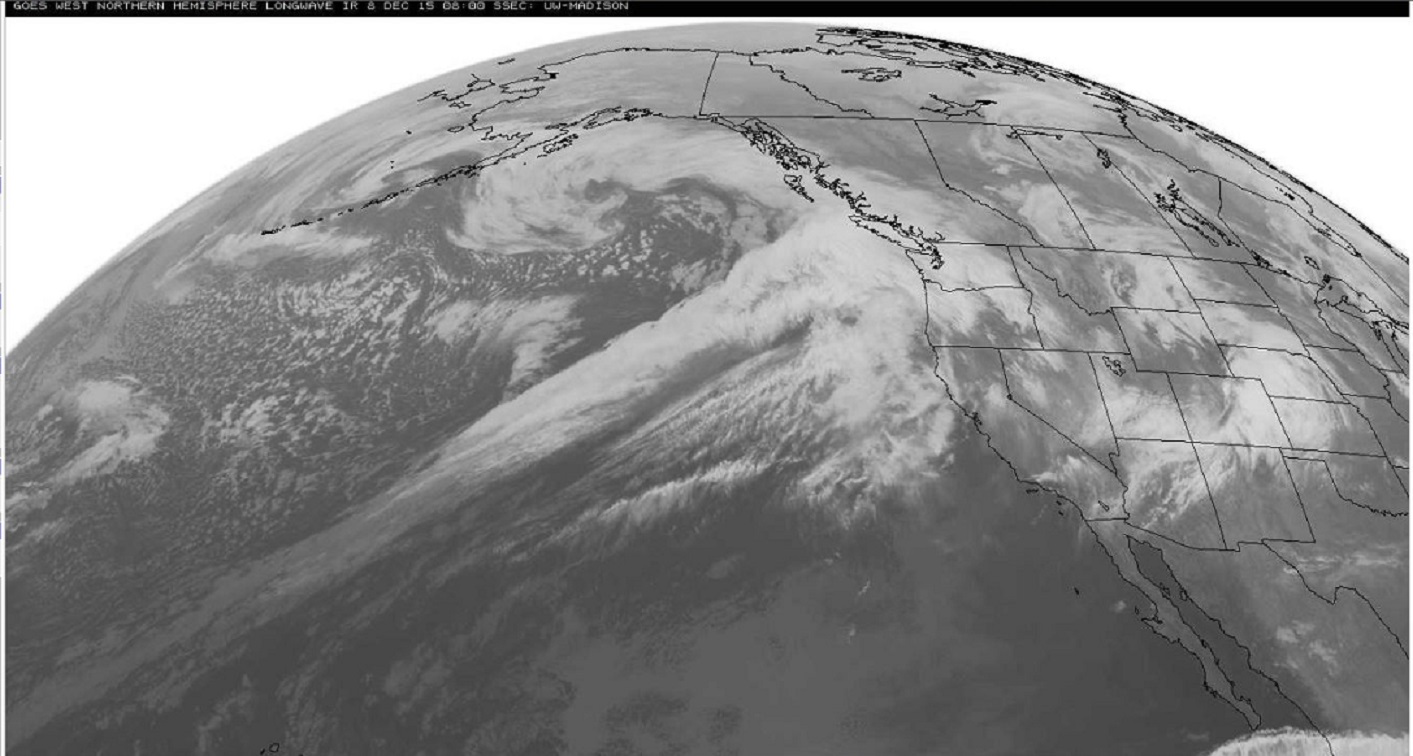
River of moisture headed into the Northwest on this Tuesday
water vapor followed by regular IR satellite.
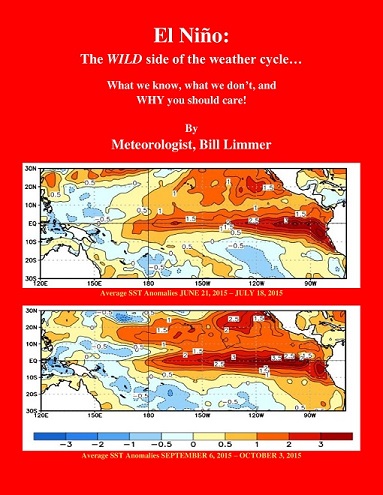
Learn more in my latest e-book El Niño: The WILD side of the weather cycle…
What we know, what we don’t, and WHY you should care!
I show how this years Pacific water temperatures compare to the 1982 and 1997 events and highlight the kind of weather episodes that these stronger El Niño’s tend to bring.
If you like the blog you will love the book.
Wild Bill.