October 23, 2015
Hurricane Patricia went from a tropical storm to a Category 5 hurricane in 24 hours. The Hurricane’s intensification rate is comparable only to Hurricane Wilma and Hurricane Gilbert, two of the mightiest Atlantic Category 5’s. More on specific numbers toward the end of today’s blog.
First, …. this monster is going to slam Mexico TODAY, Friday October 23, 2015
Only the strongest storms reach Category 5 intensity, even fewer make landfall at CATEGORY 5. All this is very bad for a small part of Mexico.
One of the strongest, largest tropical systems ever in the eastern Pacific running square into the Sierra Madre del Sur is a recipe for some incredible catastrophic event. On the map below the state of Jalisco is shaded white and also lies near the expected landfall. Puerto Vallarta of course is near sea level. Guadalajara lies near 5000 feet in elevation. The mountains in Jalisco reach from 9600 to 13000 feet. These mountains will tear up the tropical circulation but they will take a quite beating in the process.
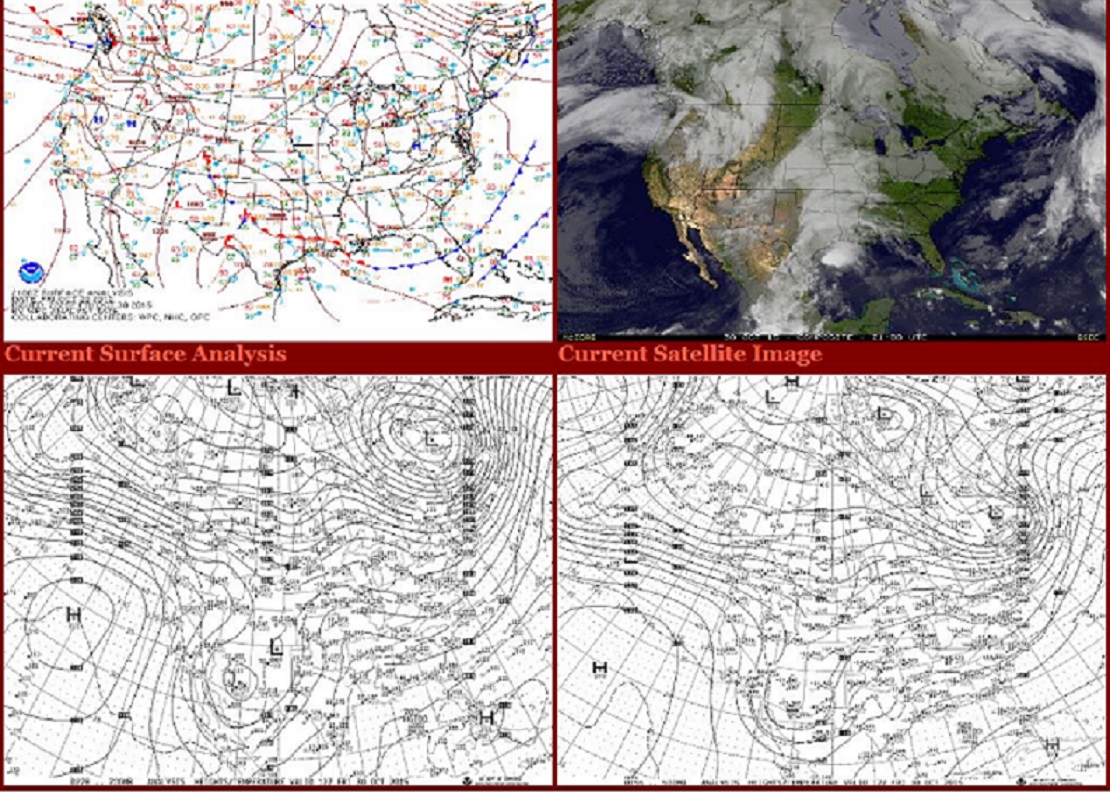
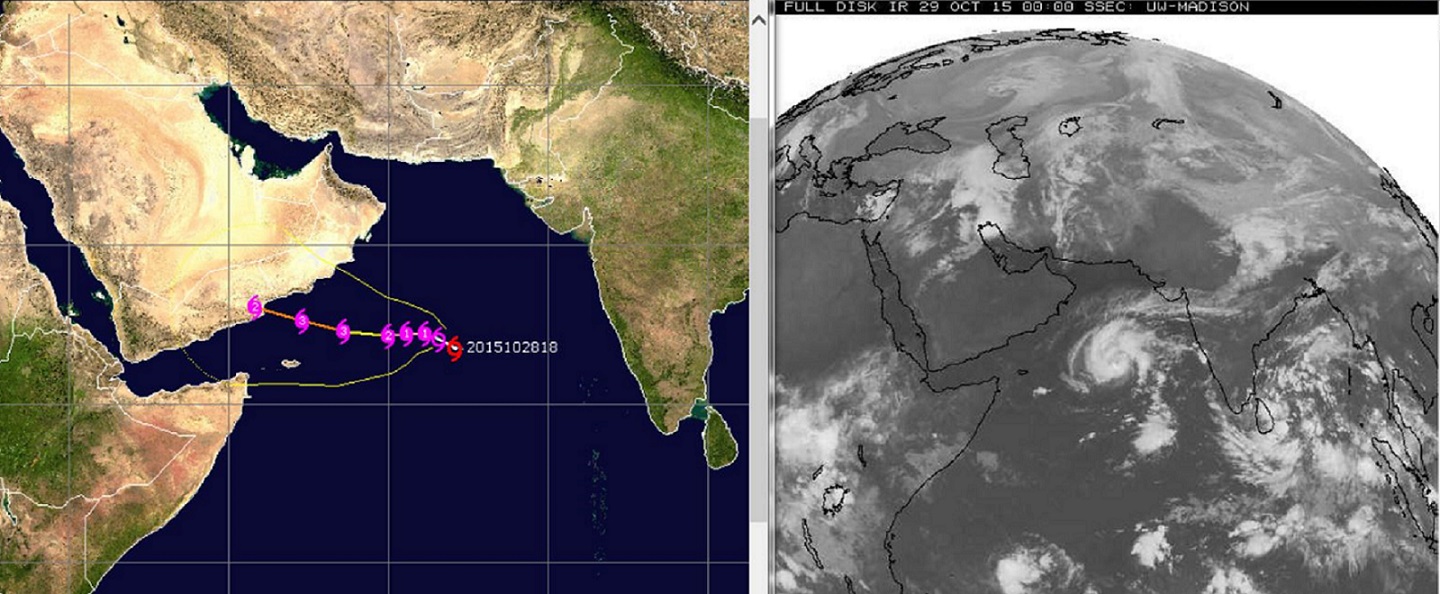
Expected track Thursday evening State of Jalisco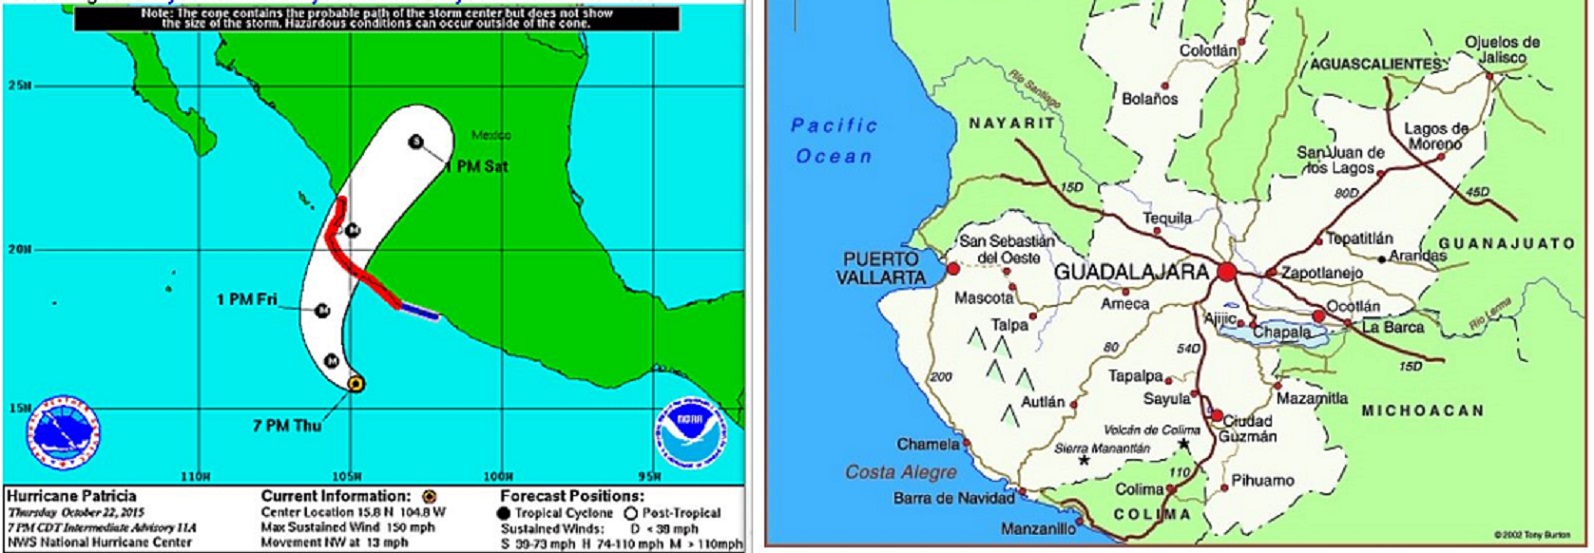
Below is the Category 5 Advisory followed by the 179 knot Advisory
——————————————————————————————————–
1000 PM CDT THU OCT 22 2015
…POTENTIALLY CATASTROPHIC HURRICANE PATRICIA TURNING TOWARD
SOUTHWESTERN MEXICO…
LOCATION…16.2N 105.1W
ABOUT 200 MI… SSW OF MANZANILLO MEXICO
ABOUT 295 MI… S OF CABO CORRIENTES MEXICO
MAXIMUM SUSTAINED WINDS…160 MPH…
PRESENT MOVEMENT…NNW OR 330 DEGREES AT 10 MPH…
MINIMUM CENTRAL PRESSURE…924 MB…27.29 INCHES
————————————————————————————————————-
1230 AM CDT FRI OCT 23 2015
…CATEGORY 5 HURRICANE PATRICIA STRENGTHENS EVEN MORE…
…POTENTIALLY CATASTROPHIC LANDFALL IN SOUTHWESTERN MEXICO LATER
TODAY…
LOCATION…16.5N 105.3W
ABOUT 185 MI…295 KM SSW OF MANZANILLO MEXICO
ABOUT 270 MI…435 KM S OF CABO CORRIENTES MEXICO
MAXIMUM SUSTAINED WINDS...185 MPH…295 KM/H
PRESENT MOVEMENT…NNW OR 330 DEGREES AT 10 MPH…17 KM/H
MINIMUM CENTRAL PRESSURE…892 MB…26.34 INCHES
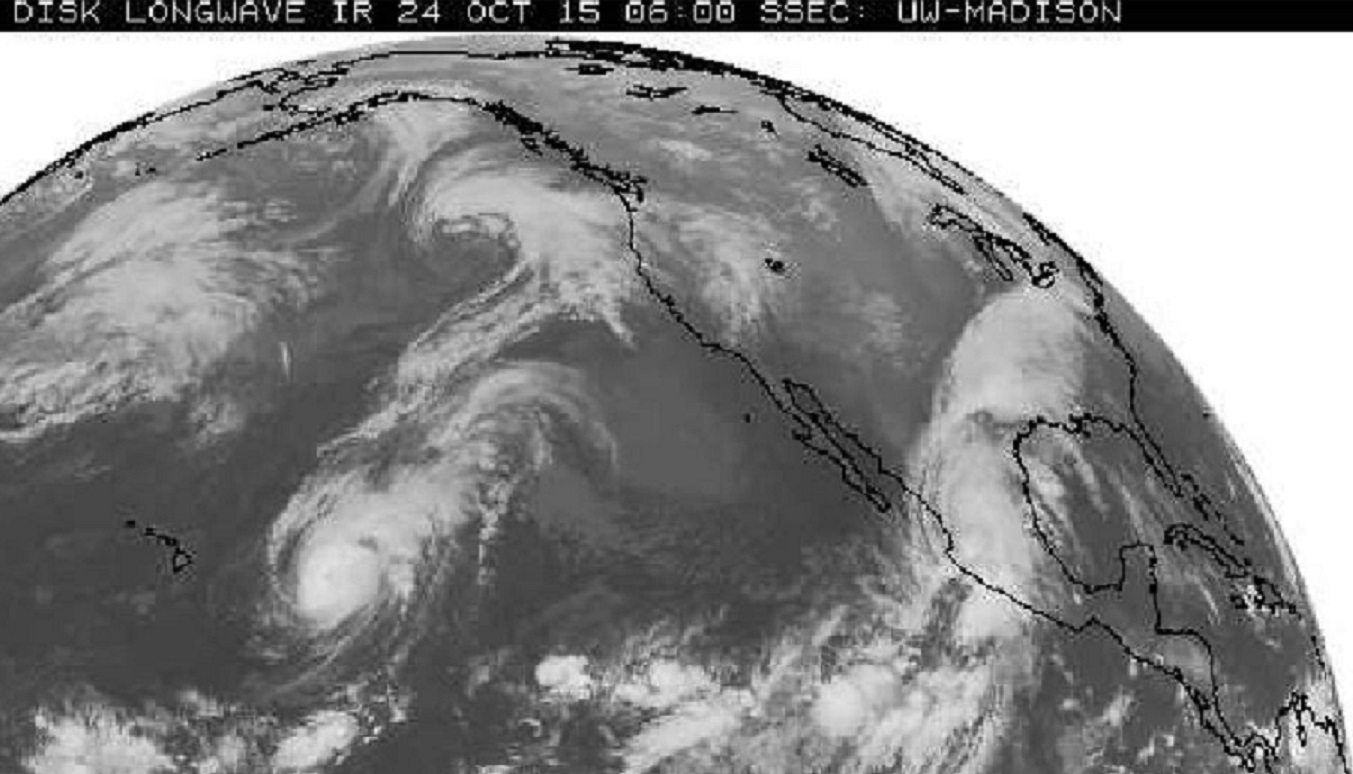
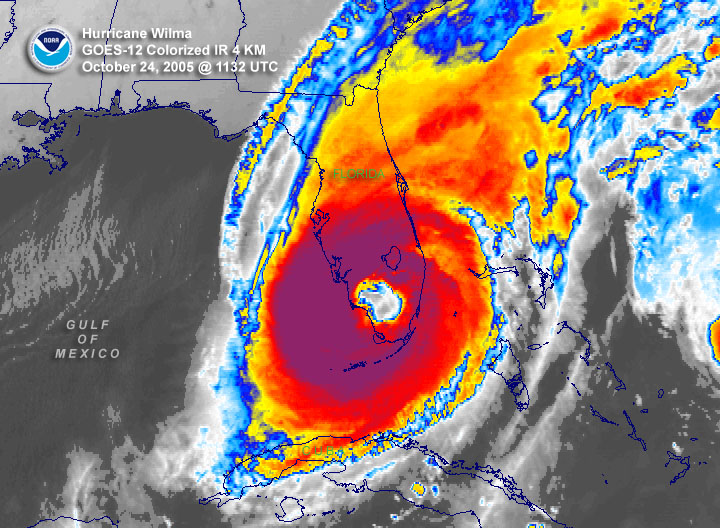
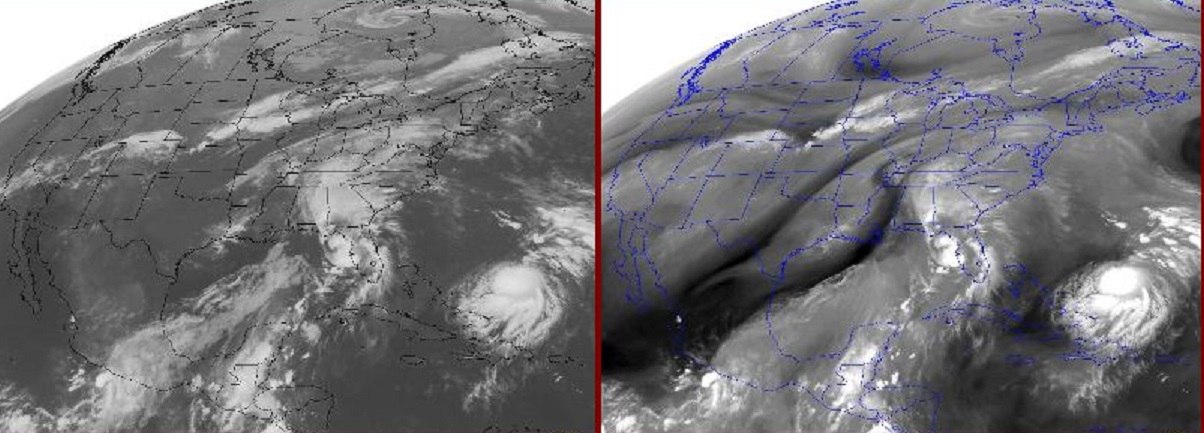
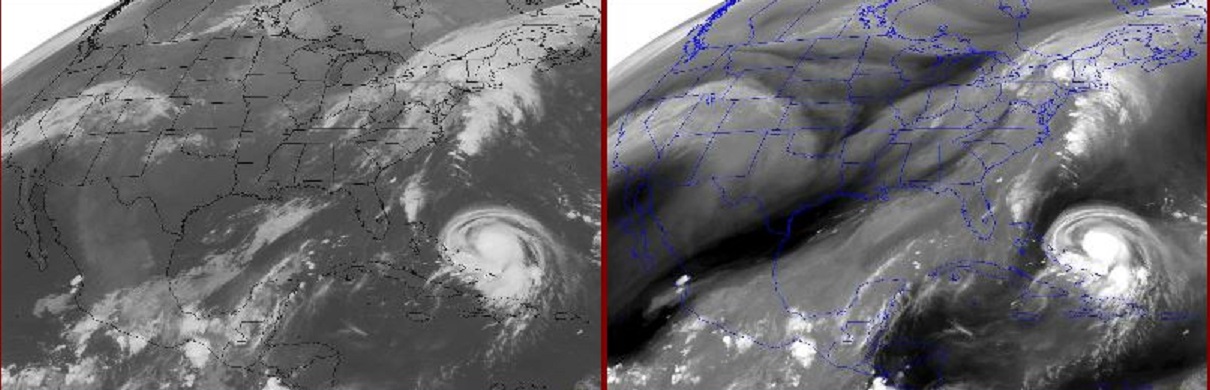
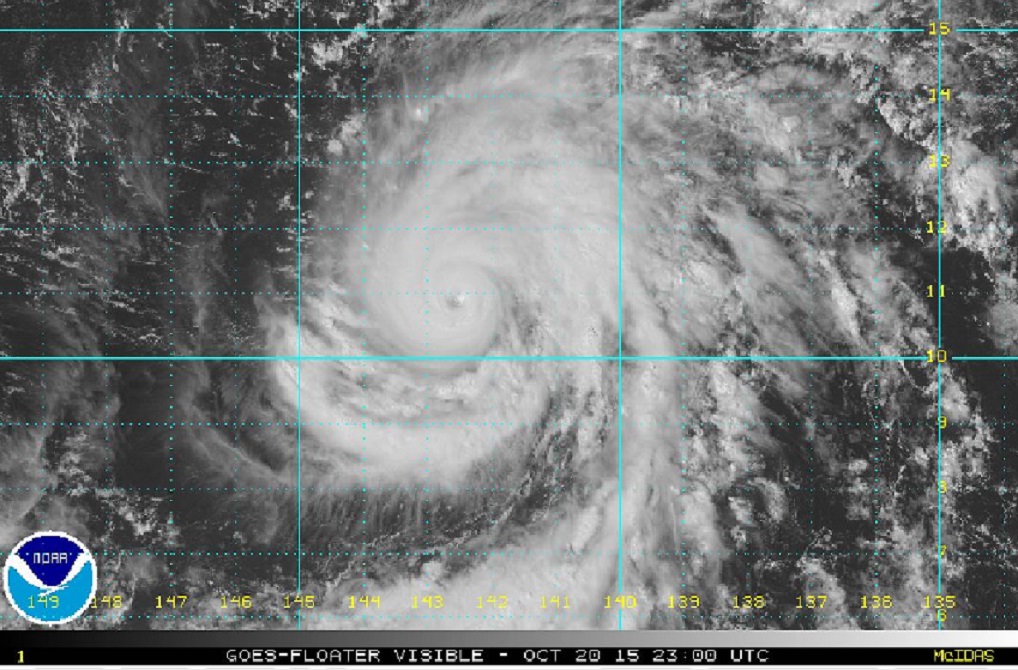
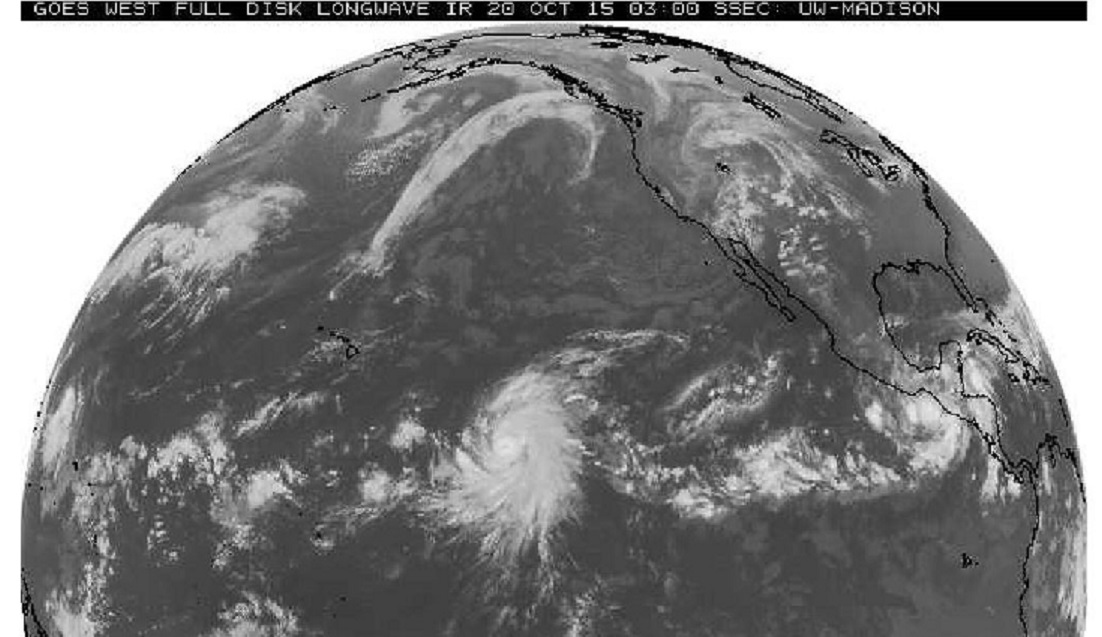
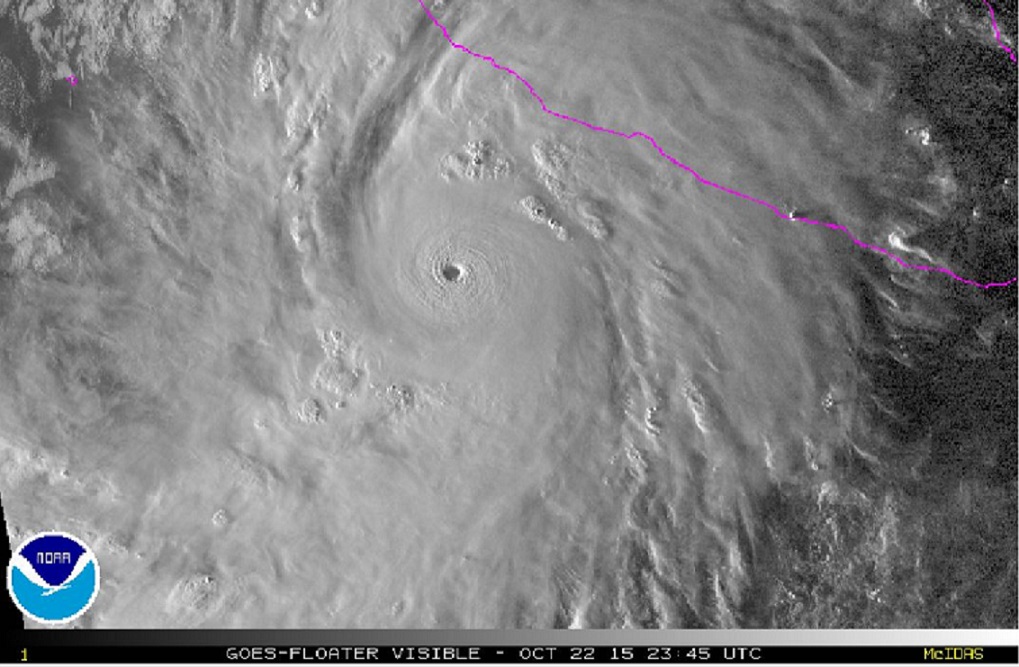
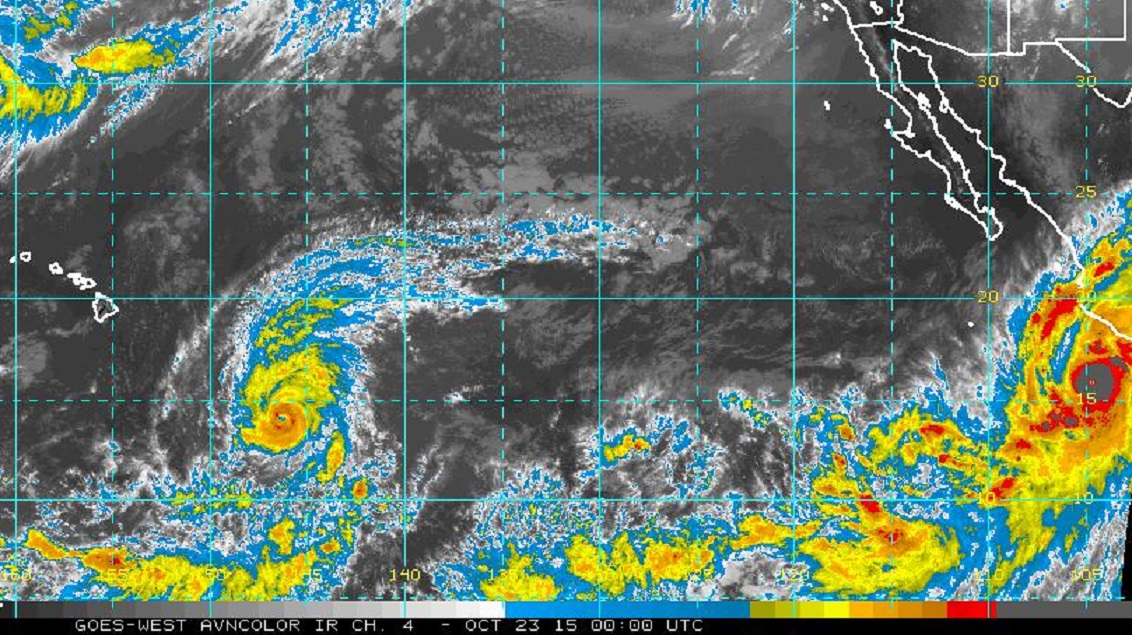
…185MPH…, 892 MB, and in the image below, the gray on top of the red around the center, all signs of the strongest of storms. Landfall within 24 hours of reaching this state again, “a recipe for catastrophe”.
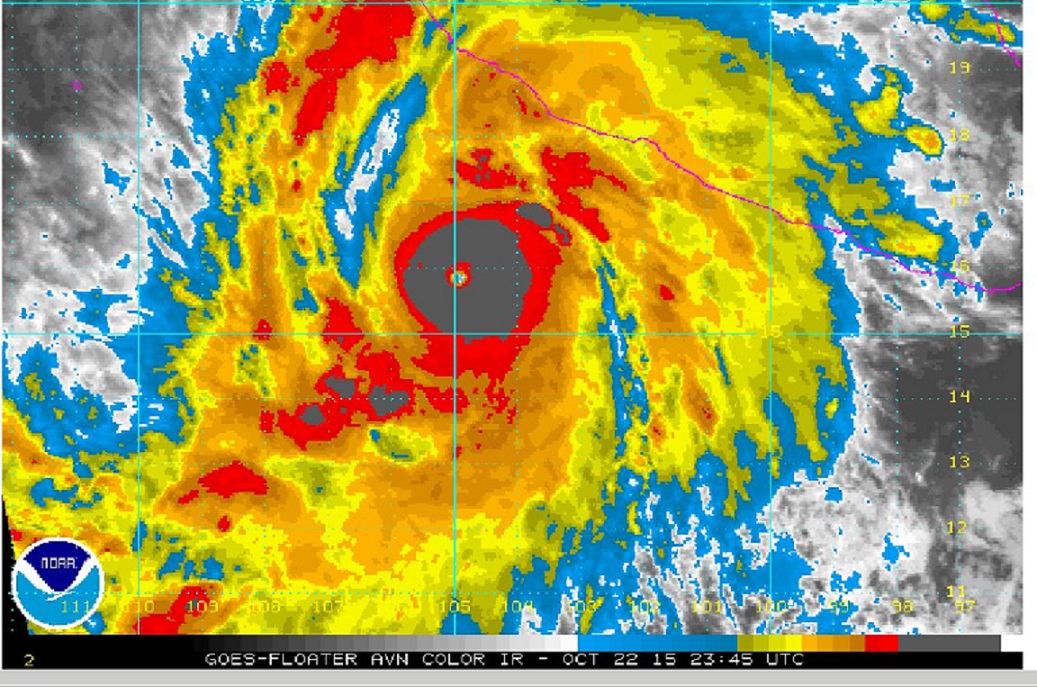
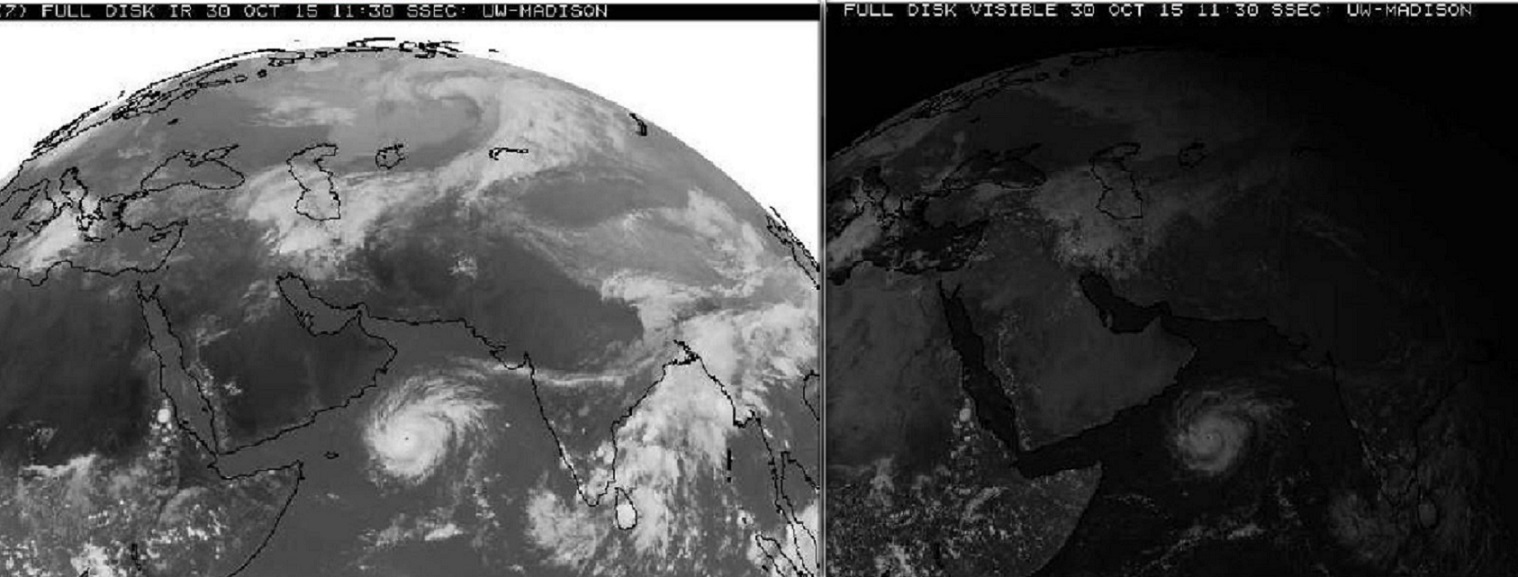
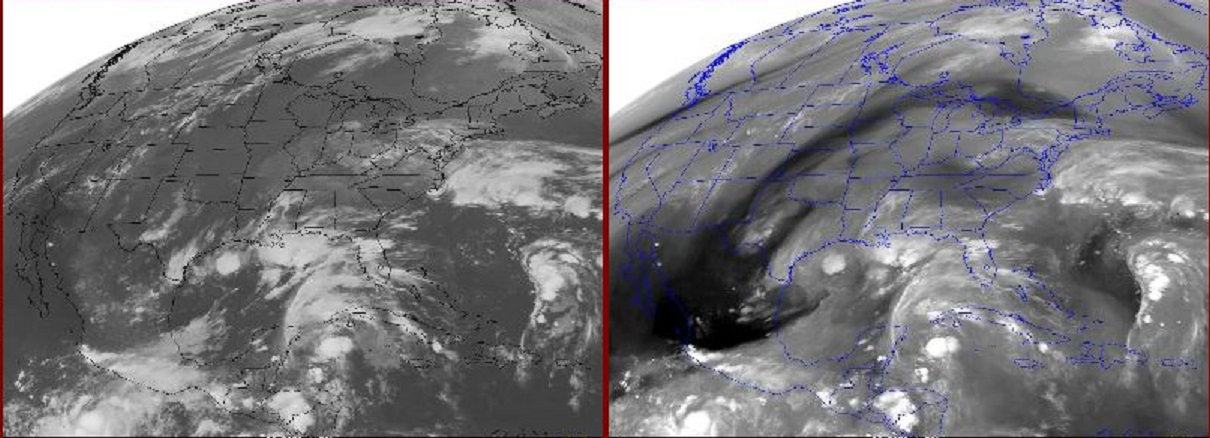
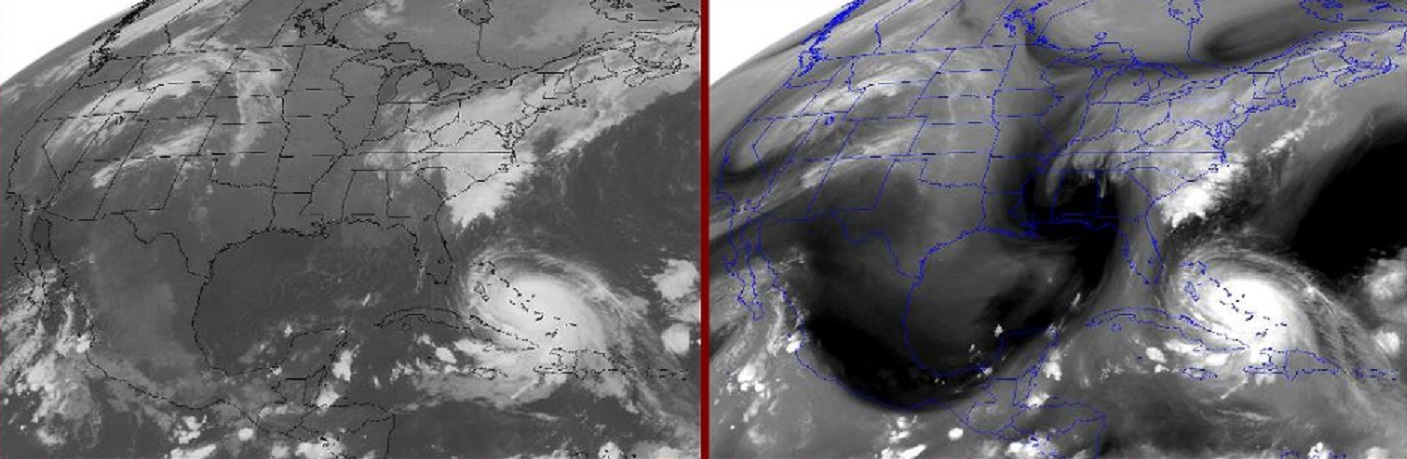
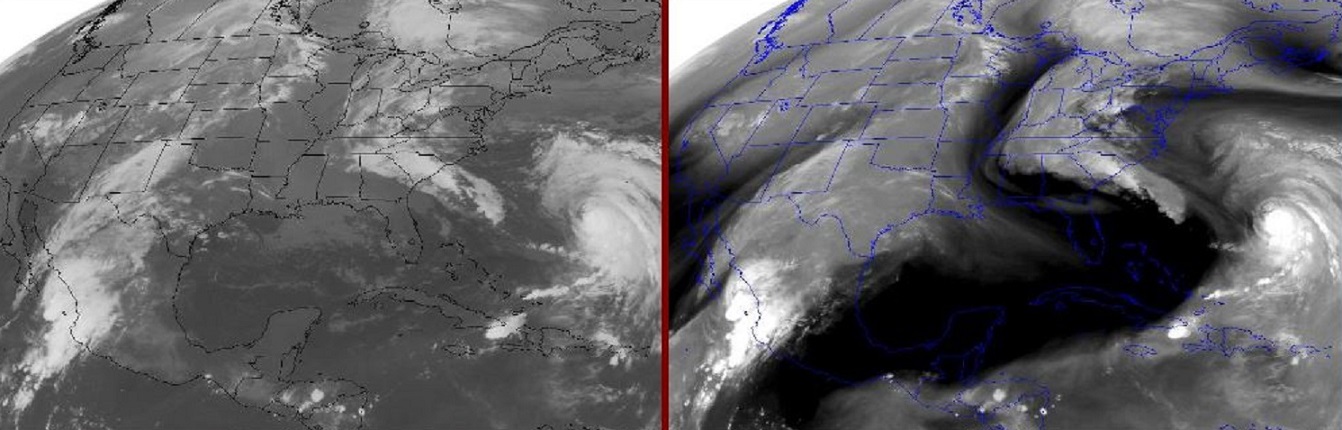
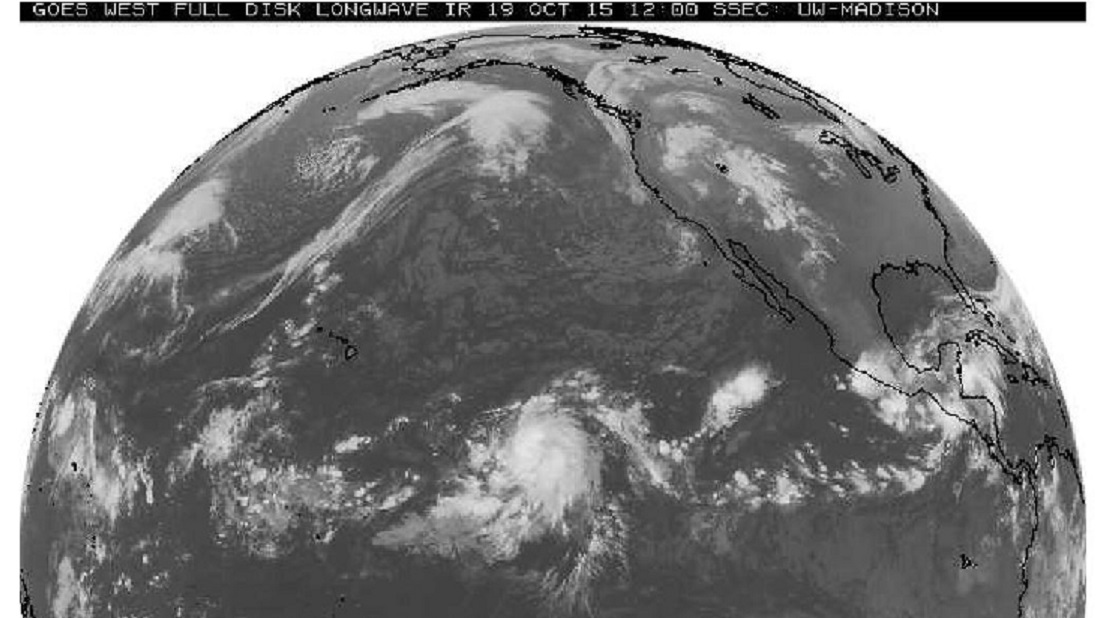
Color IR above to show intensity. Visible below to show size of cloud mass
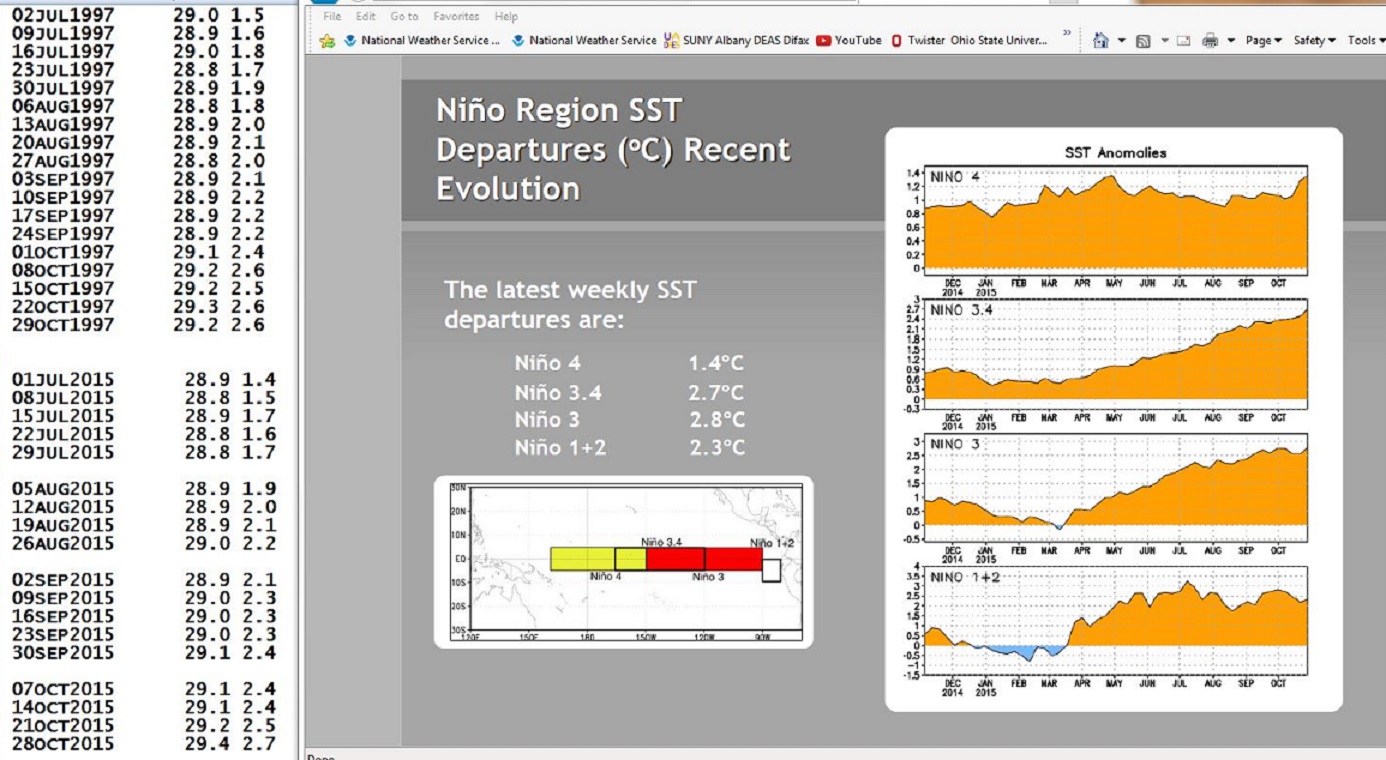
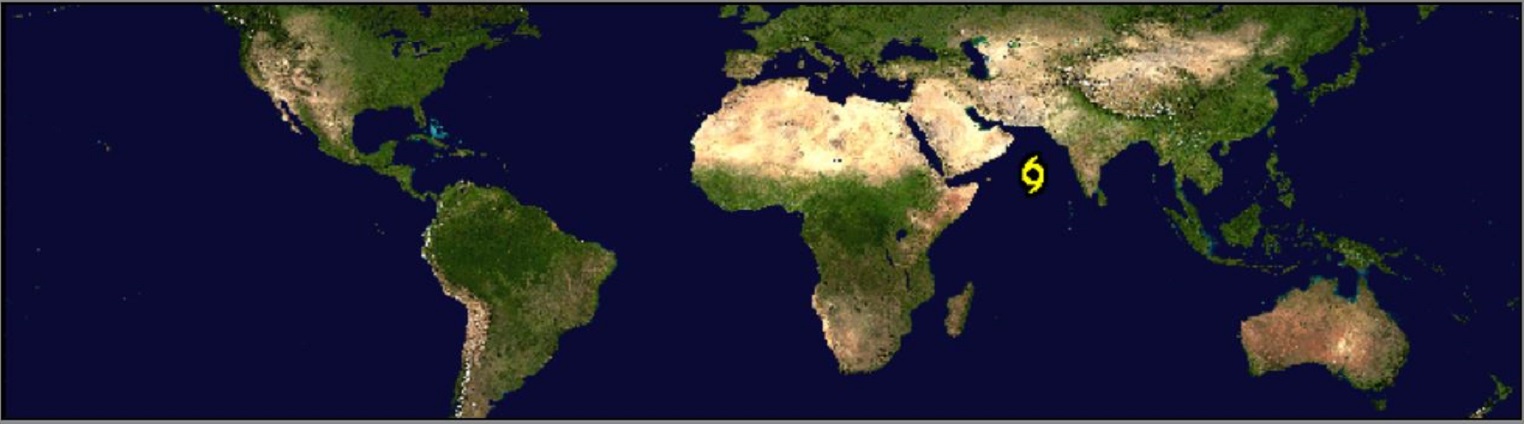
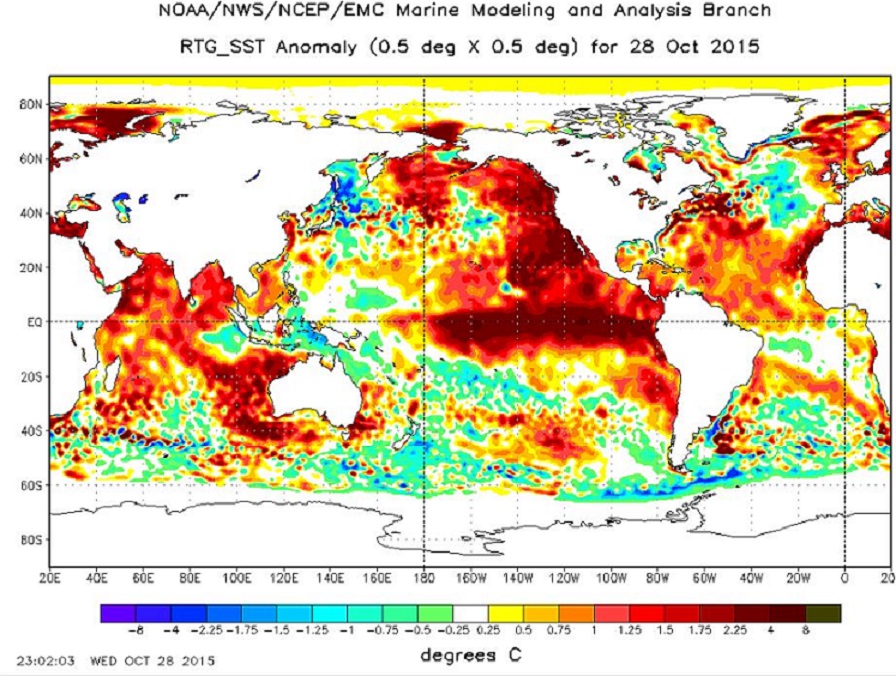
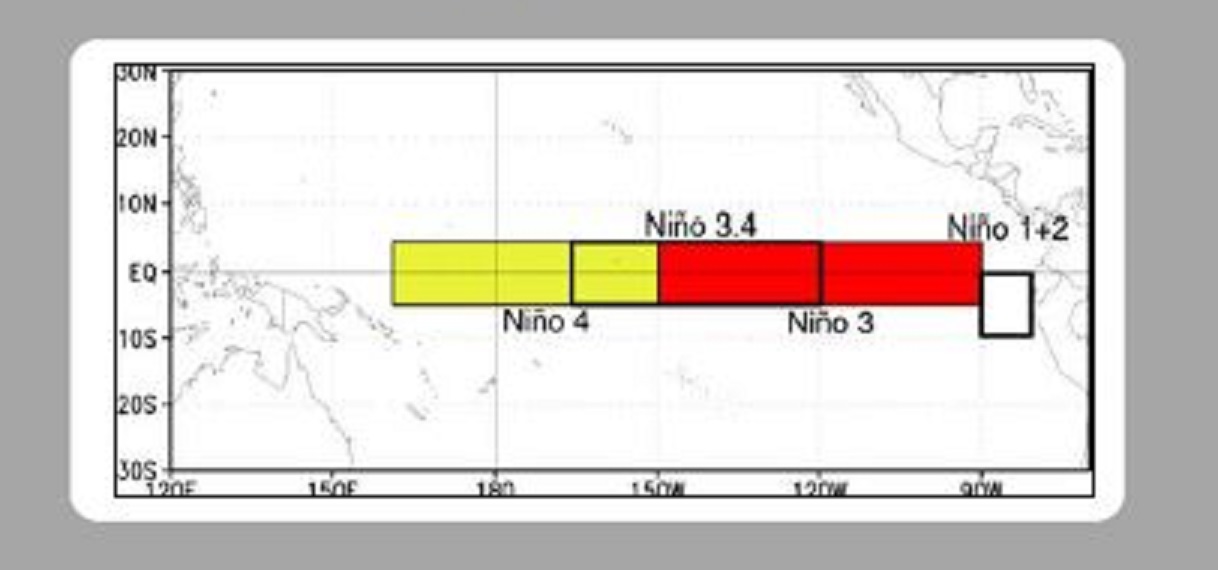
Two significant hurricanes at the same time in the central and eastern Pacific in late October is a continuing sign of the unusually warm ocean waters associated with our current El Niño.
A look at 24 hour changes 1000 PM Advisory to 1000 PM Advisory
————————————————————————————————————————
1000 PM CDT WED OCT 21 2015
…PATRICIA EXPECTED TO BECOME A HURRICANE BY THURSDAY MORNING…
LOCATION…13.5N 100.5W
ABOUT 240 MI…385 KM S OF ACAPULCO MEXICO
ABOUT 455 MI…735 KM SE OF MANZANILLO MEXICO
MAXIMUM SUSTAINED WINDS…65 MPH…
PRESENT MOVEMENT…WNW OR 290 DEGREES AT 14 MPH…
MINIMUM CENTRAL PRESSURE…994 MB…29.36 INCHES
————————————————————————————————————————
1000 PM CDT THU OCT 22 2015
…POTENTIALLY CATASTROPHIC HURRICANE PATRICIA TURNING TOWARD
SOUTHWESTERN MEXICO…
LOCATION…16.2N 105.1W
ABOUT 200 MI… SSW OF MANZANILLO MEXICO
ABOUT 295 MI… S OF CABO CORRIENTES MEXICO
MAXIMUM SUSTAINED WINDS…160 MPH…
PRESENT MOVEMENT…NNW OR 330 DEGREES AT 10 MPH…
MINIMUM CENTRAL PRESSURE…924 MB…27.29 INCHES
————————————————————————–
in 24 hours:
1000 PM CDT WED OCT 21 2015 to 1000 PM CDT THU OCT 22 2015
…65 MPH… to …160 MPH… increase of 95mph in 24 hours
…994 MB… to …924 MB… decrease of 70mb in 24 hours
Not sure about Eastern Pacific specifics, Hurricane Center when discussing Patricia rapid intensification points to,
“This is a remarkable feat, with only Linda of 1997 intensifying at this rate in the satellite
era.”
Need to add, “In the eastern Pacific basin”, … and also, Notice the year??
In the Atlantic the 24 hour intensification champs are well known Category 5’s.
97mb in Hurricane Wilma from 1200 18 October 2005 to 1200 UTC 19 October 2005.
72mb in Hurricane Gilbert, September 1988.
—————————————————————————————————————
The 12:30AM Special Advisory makes quick 24 hour calculations much more difficult. This is a Historical event, further statements will be forthcoming from the Hurricane Center. It appears records have been set for intensity, and speed of intensification, and not only for the Eastern Pacific. The 10p to 10p numbers already challenge Wilma and Gilbert. The newest values may exceed some of their records.
—————————————————————————————————————-
So, true blue serious historical stuff at least for the Mexican coast not far from Puerto Vallarta and the states surrounding the state of Jalisco. Serious life threatening, environment changing, catastrophic destruction is associated with storms of this size and strength.
One last thought, this may all seem very far away, but many of us spend several summer nights adoring parts of this beautiful Mexican coastline. Anyone see Bachelor in Paradise? That resort was a day trip from Puerto Vallarta. Puerto Vallarta is in the cone for this storm.
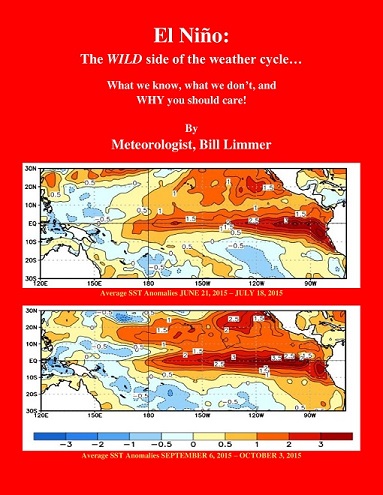
Learn more in my latest e-book El Niño: The WILD side of the weather cycle…
What we know, what we don’t, and WHY you should care!
Available at Amazon
Wild Bill