February 01, 2016
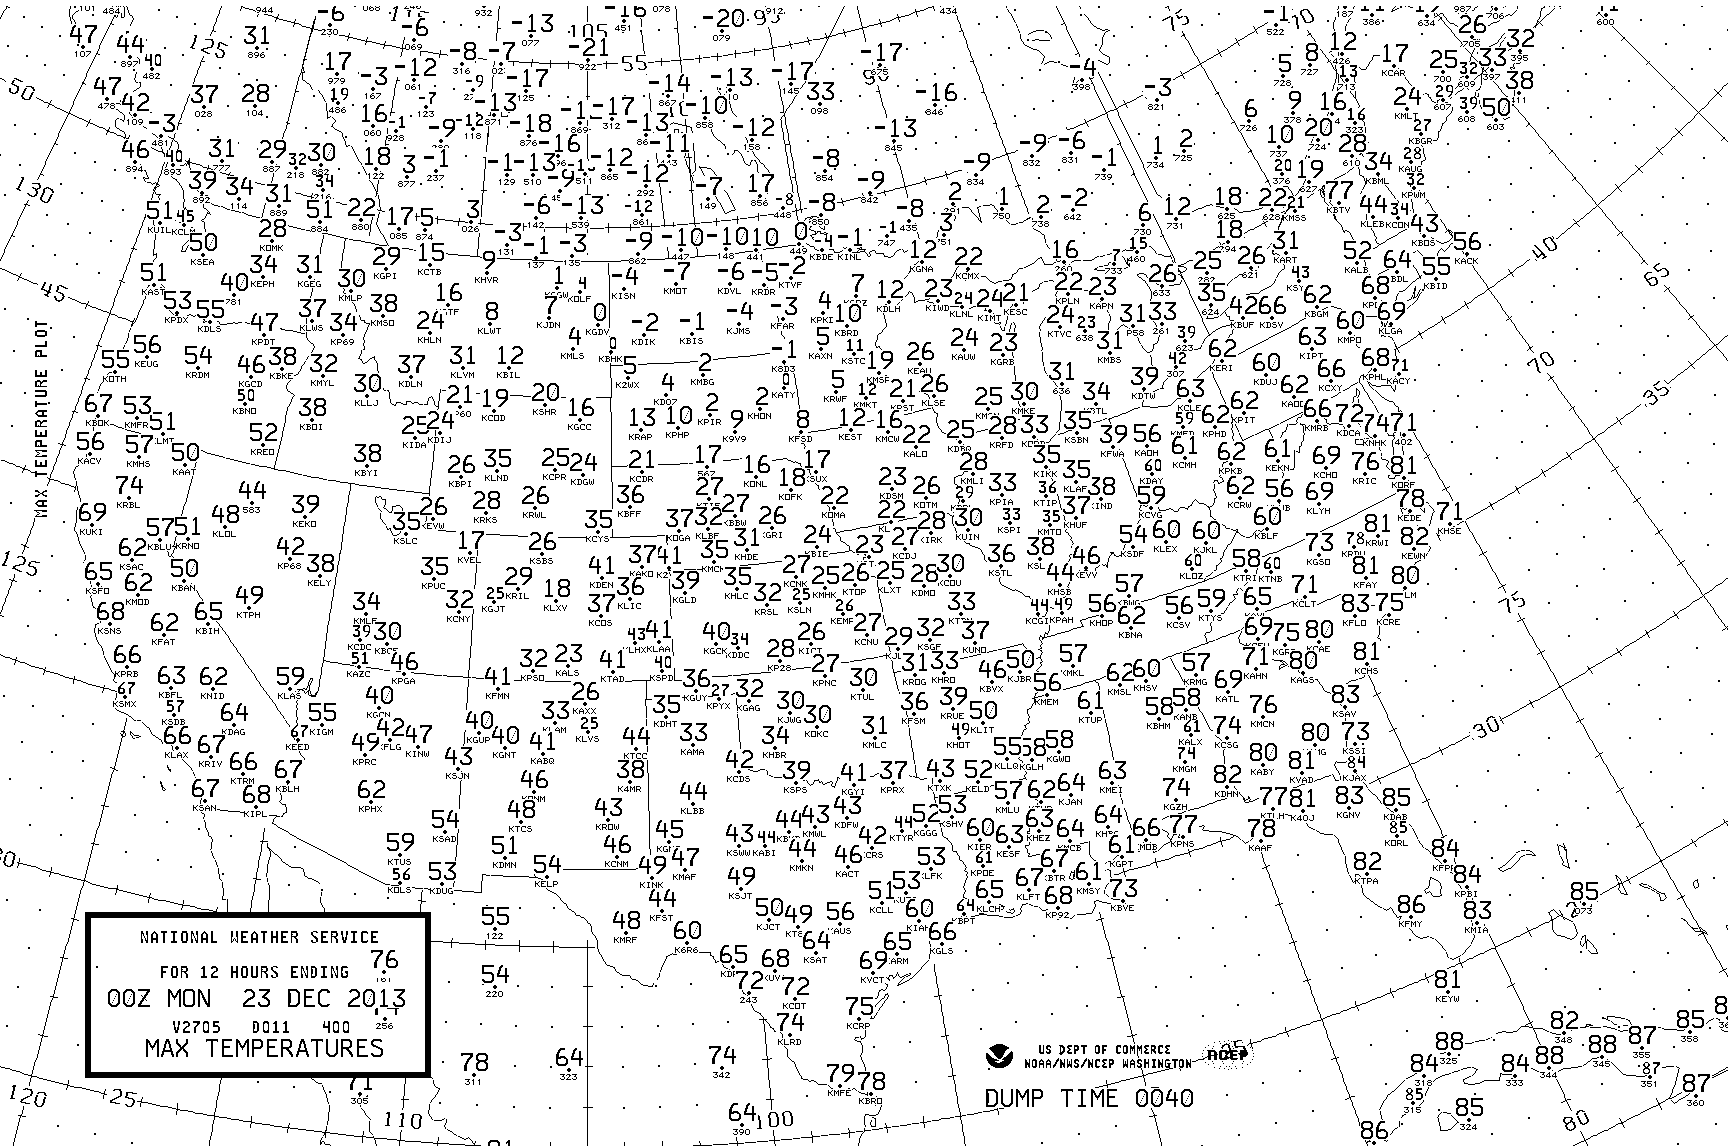
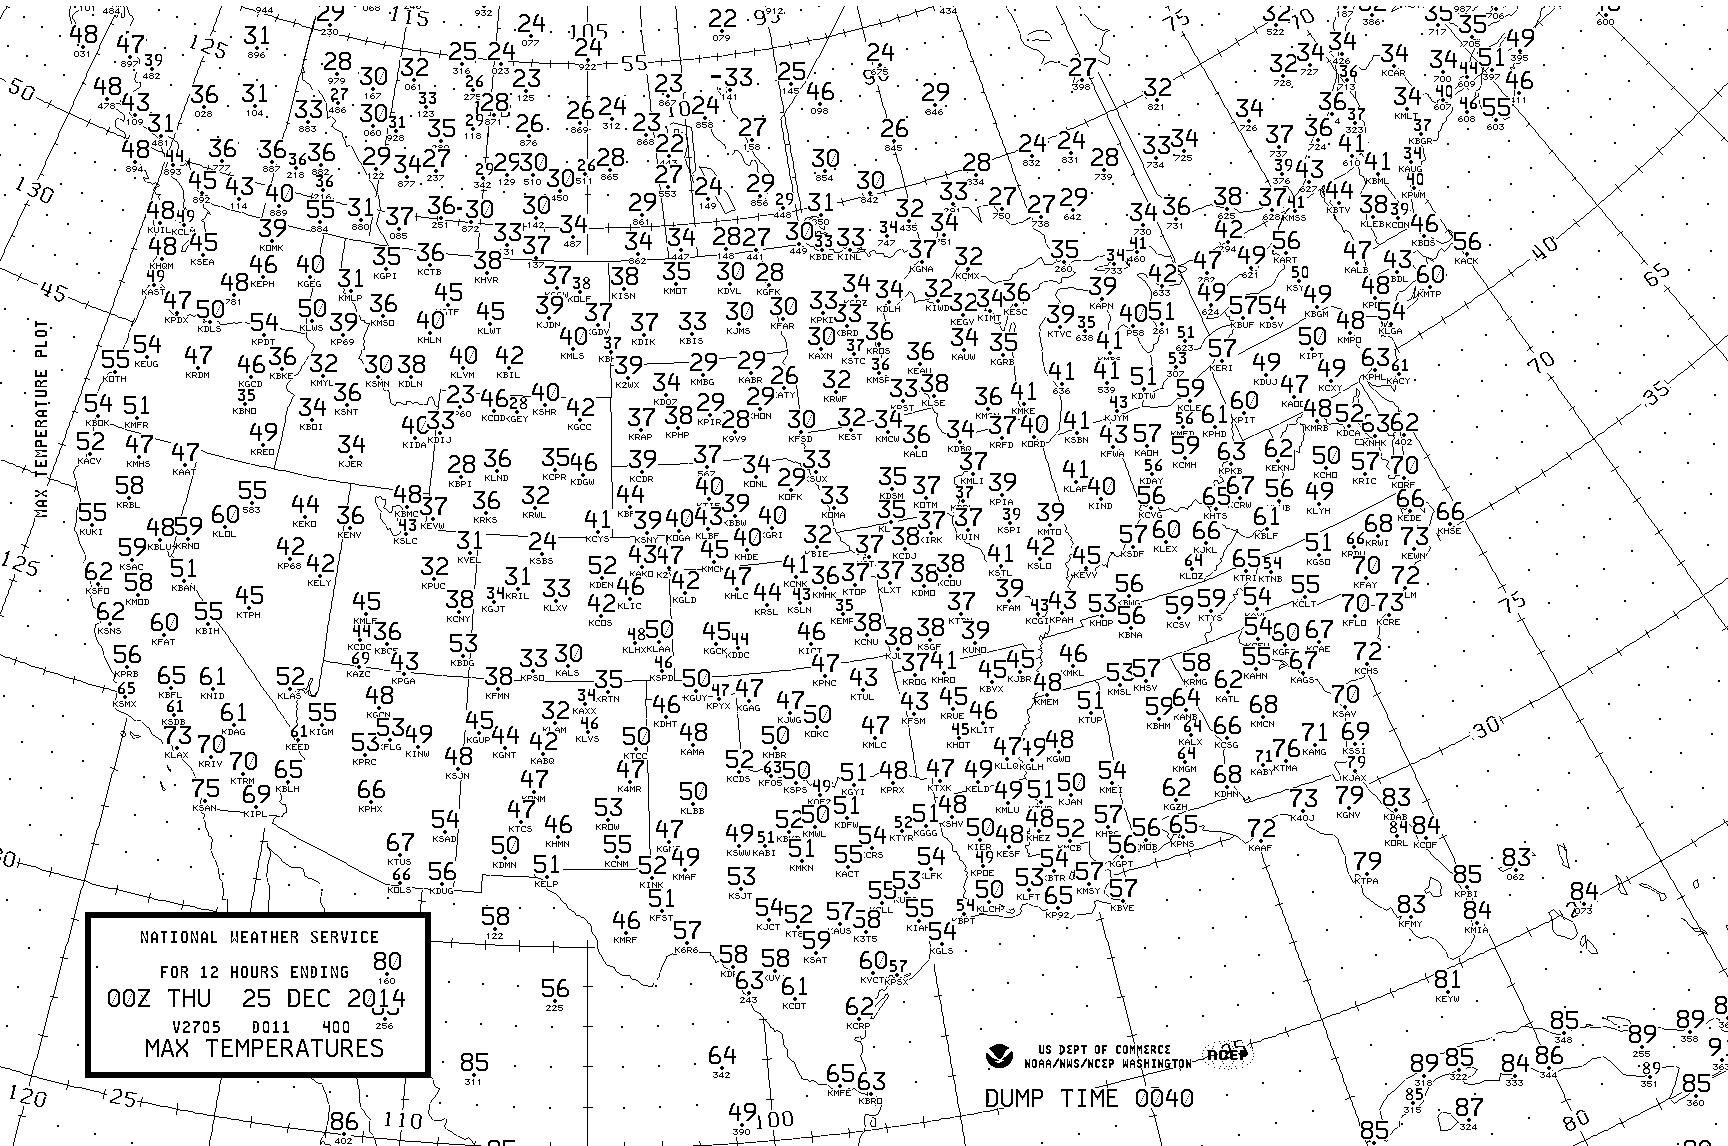
Severe weather threat on the horizon for Tuesday. This is the Storm Prediction Center’s Day 2 outlook for tomorrow, Tuesday February 2, 2016. Sunday’s afternoon highs were plenty warm in the Southern United States to support a bout of spring-like severe storms in the dead of winter.
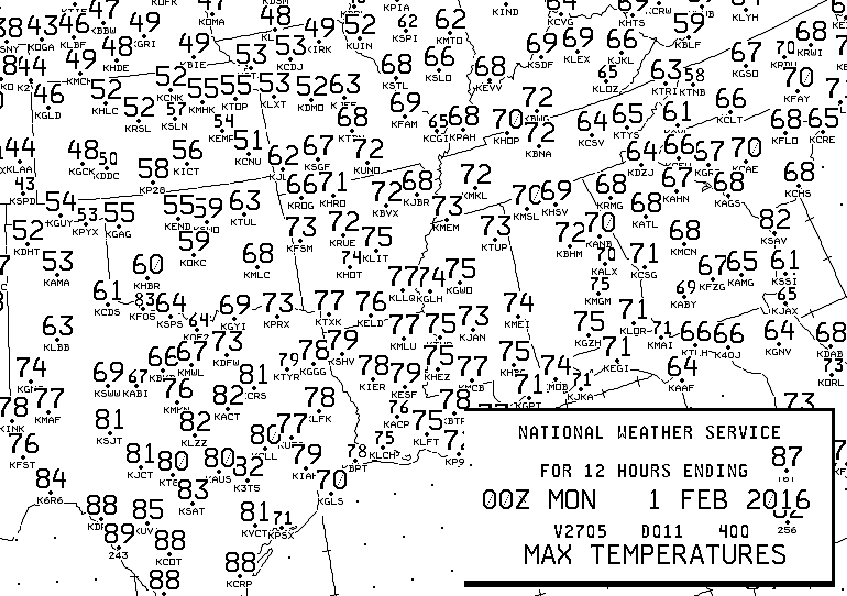
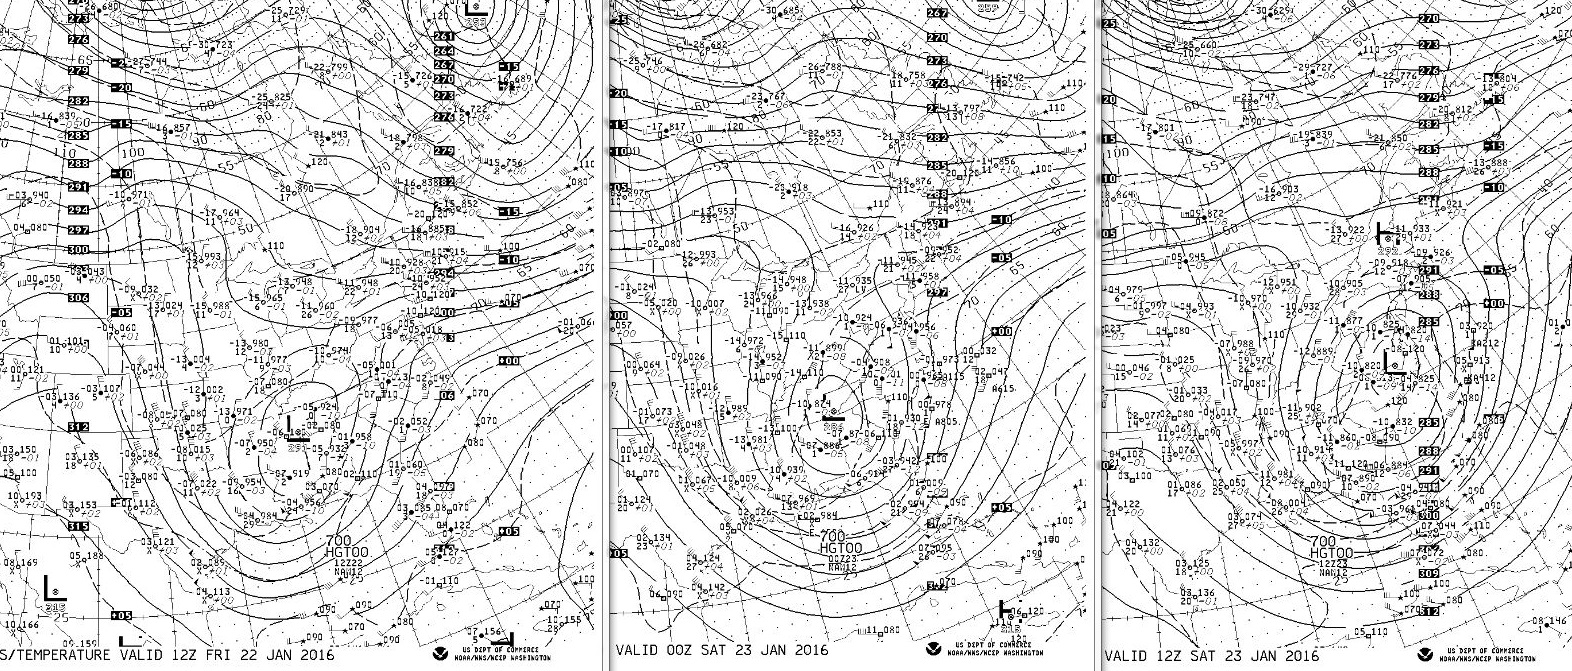
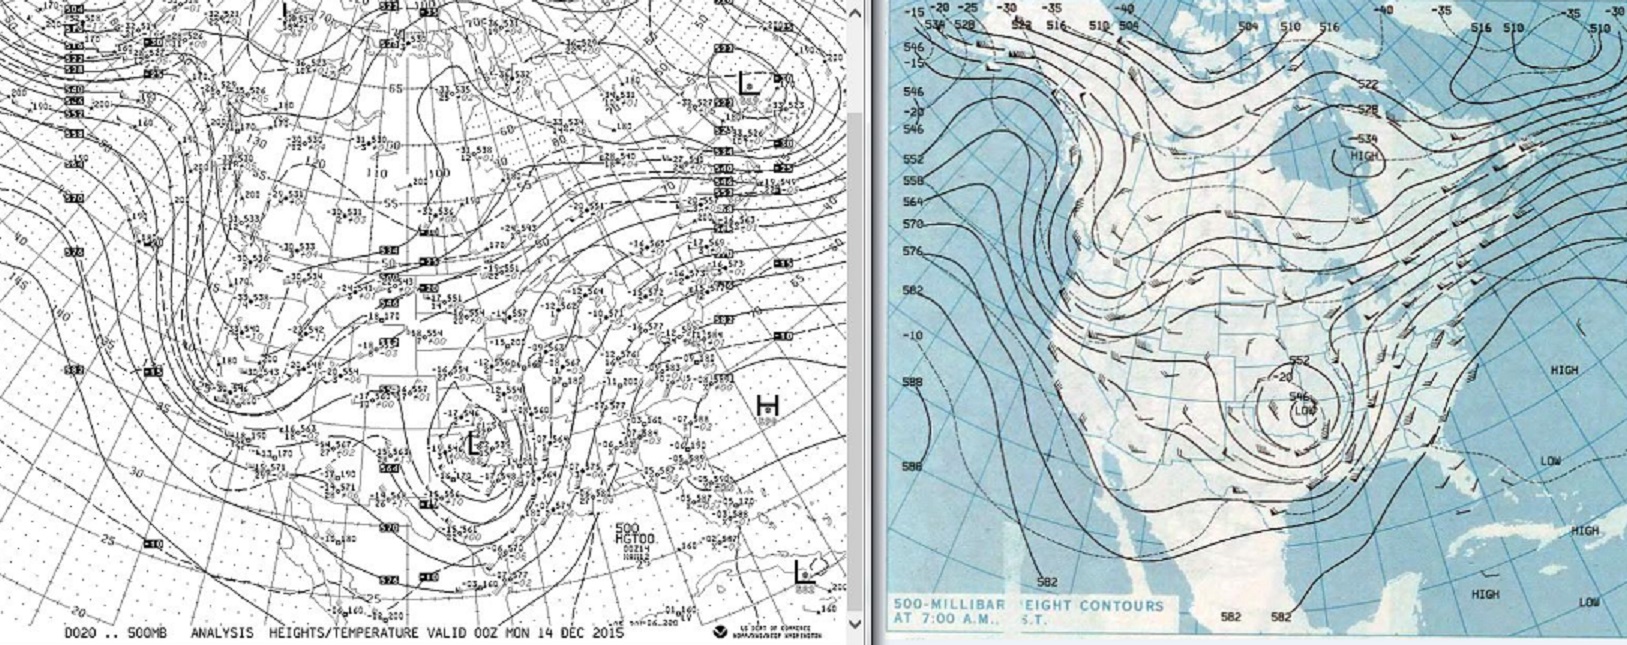
The jet stream and surface features in almost perfect alignment for severe weather in the SPC’s outlook area. Below are 500mb and surface forecast for 21z Tuesday afternoon.
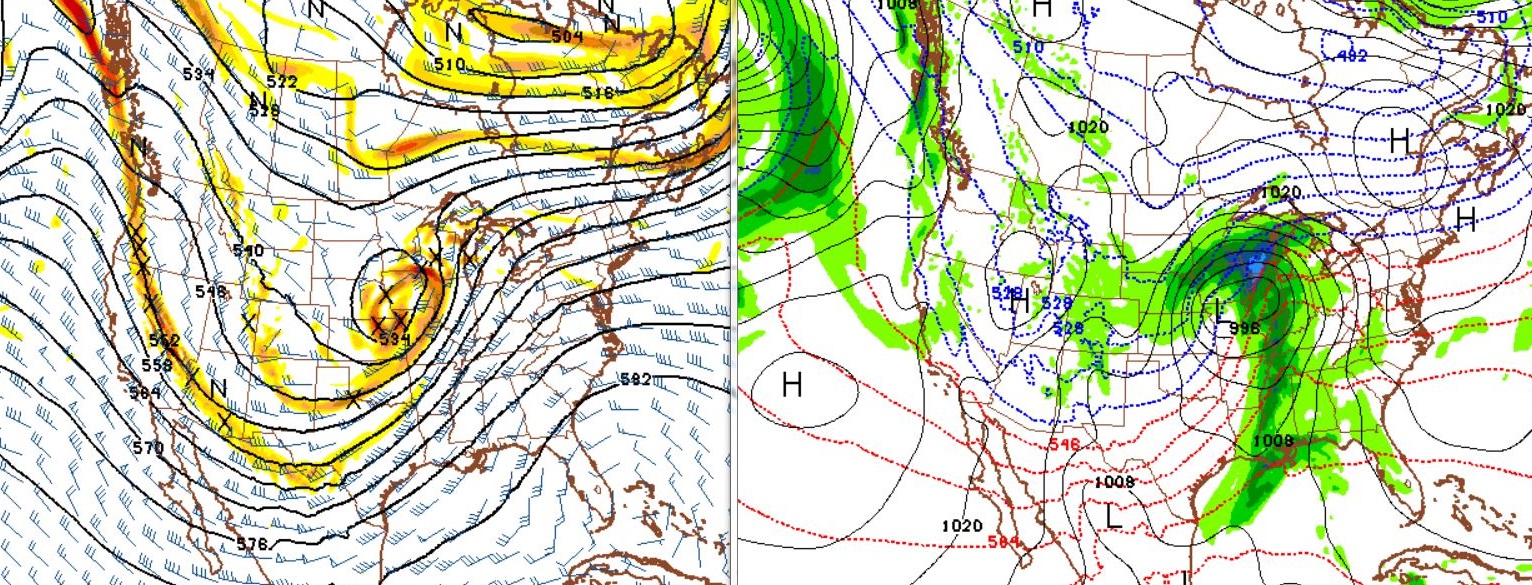
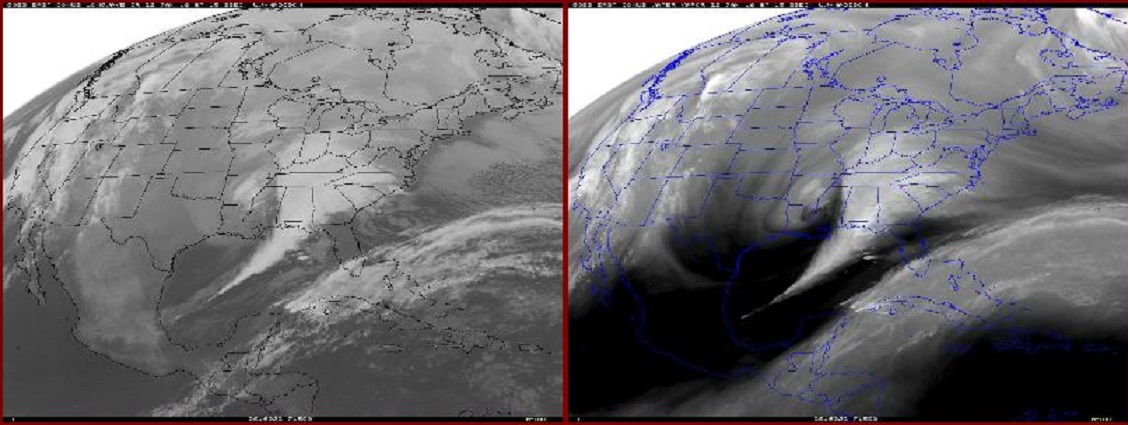
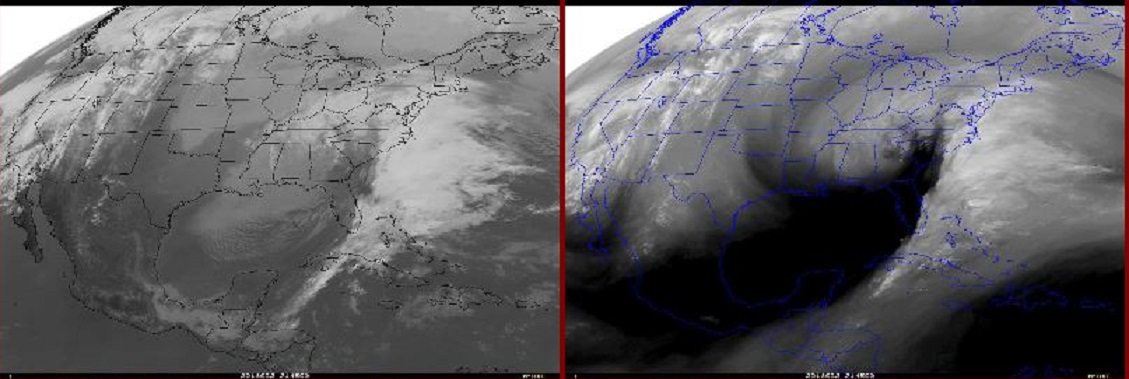
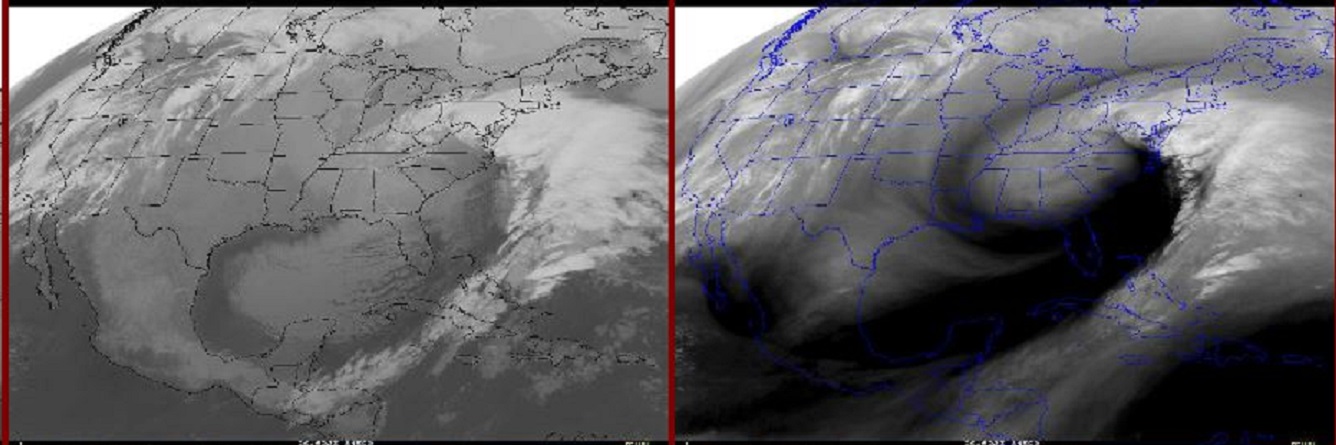
Now compare the forecast 500mb for later today, 00z February 02, 2016
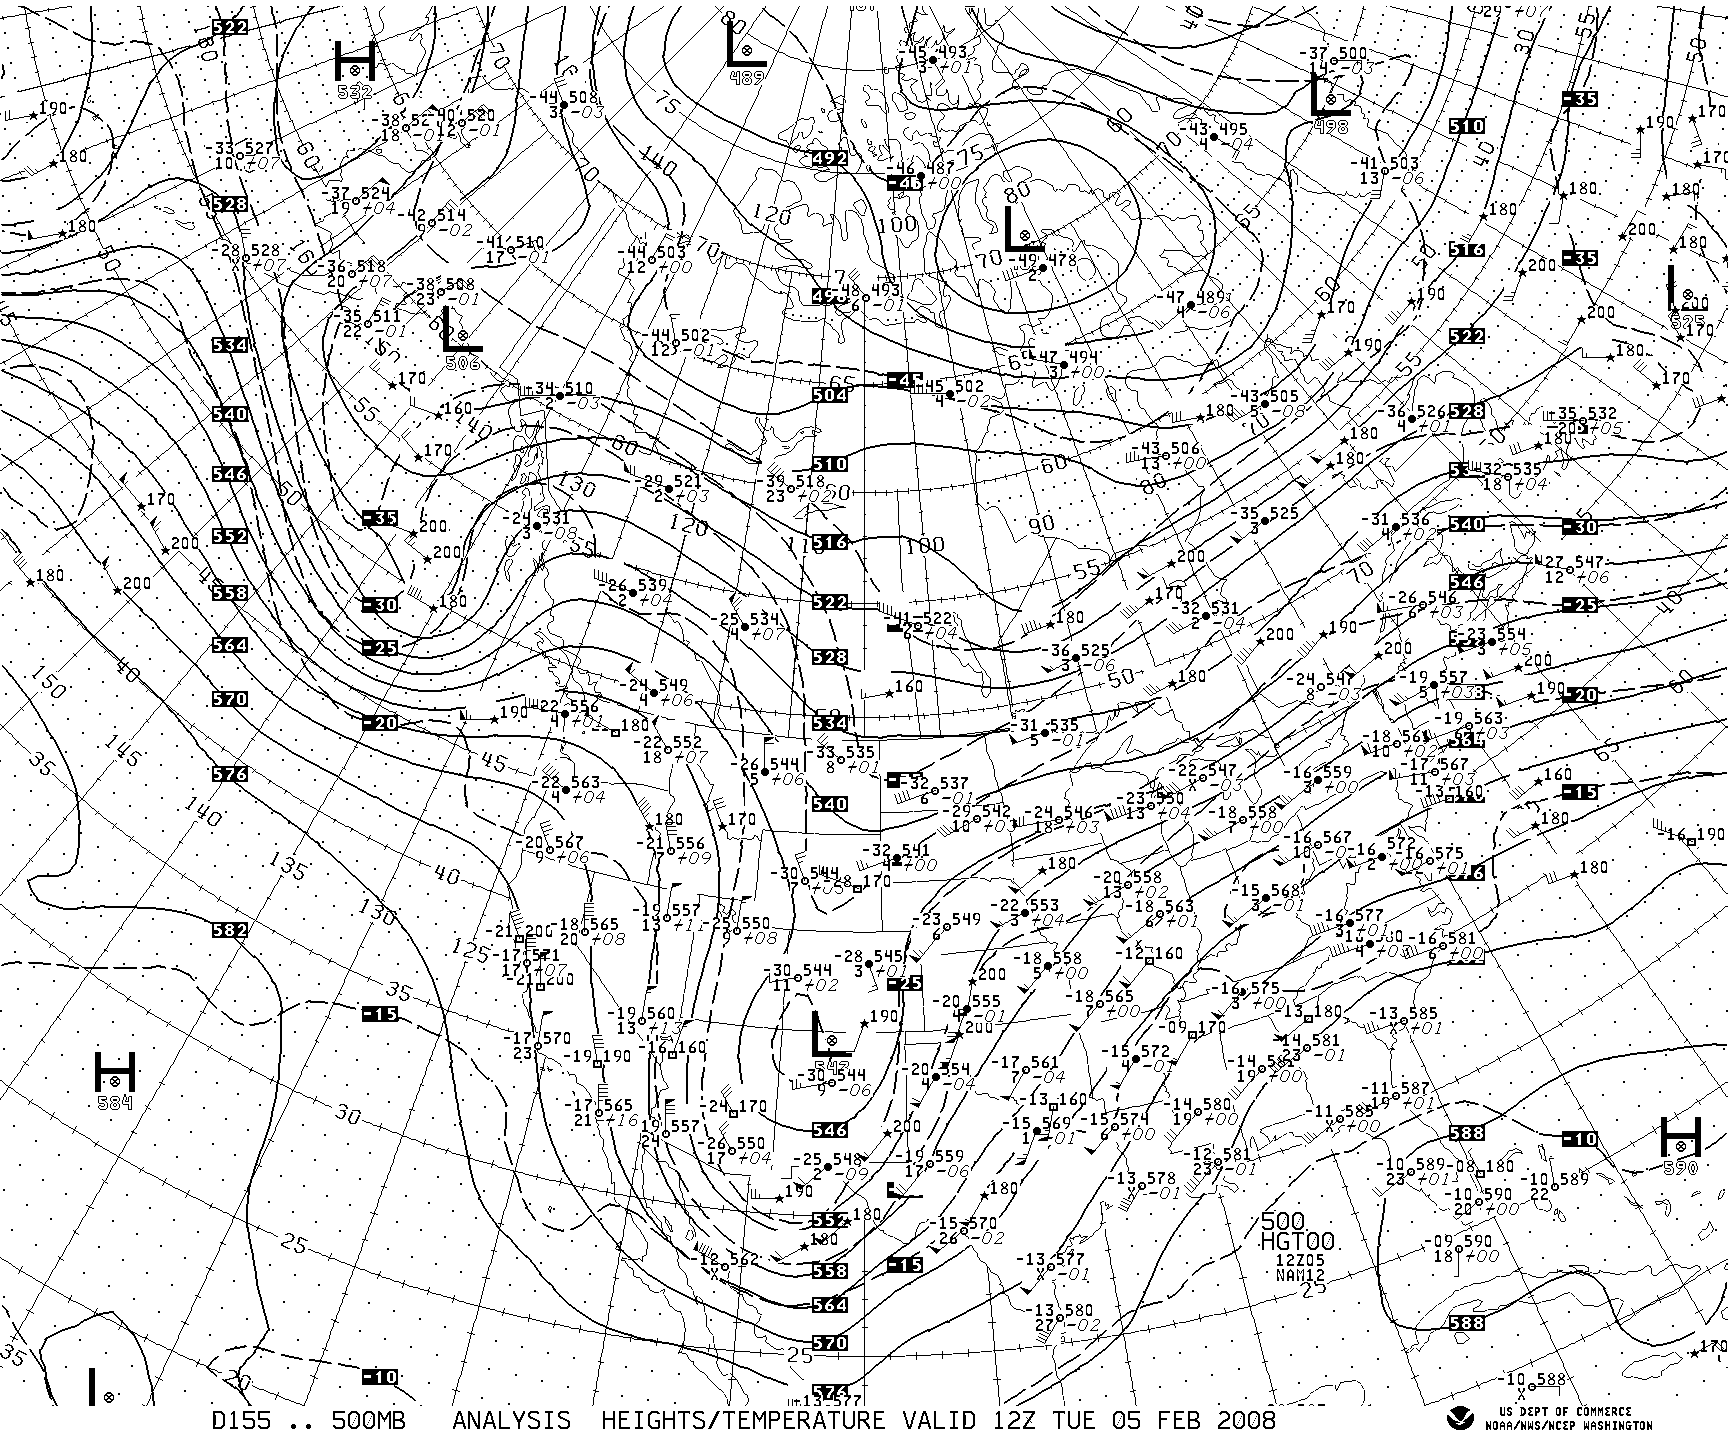
with 12z February 05, 2008, the beginning of the Super Tuesday Outbreak that produced 87 tornadoes over two days killing 56. The features the two maps have in common would include the event driving deep upper low vicinity Colorado/New Mexico Border, the kicker, just west of the Pacific Northwest, the next disturbance in the series and the polar vortex well north over Hudson’s bay.
So, heads up, weather folks are all bent out of shape about this one for a reason. If you do live in the yellow slight risk area, or orange enhanced region there is a real threat for damaging weather with the passage of this weather system.
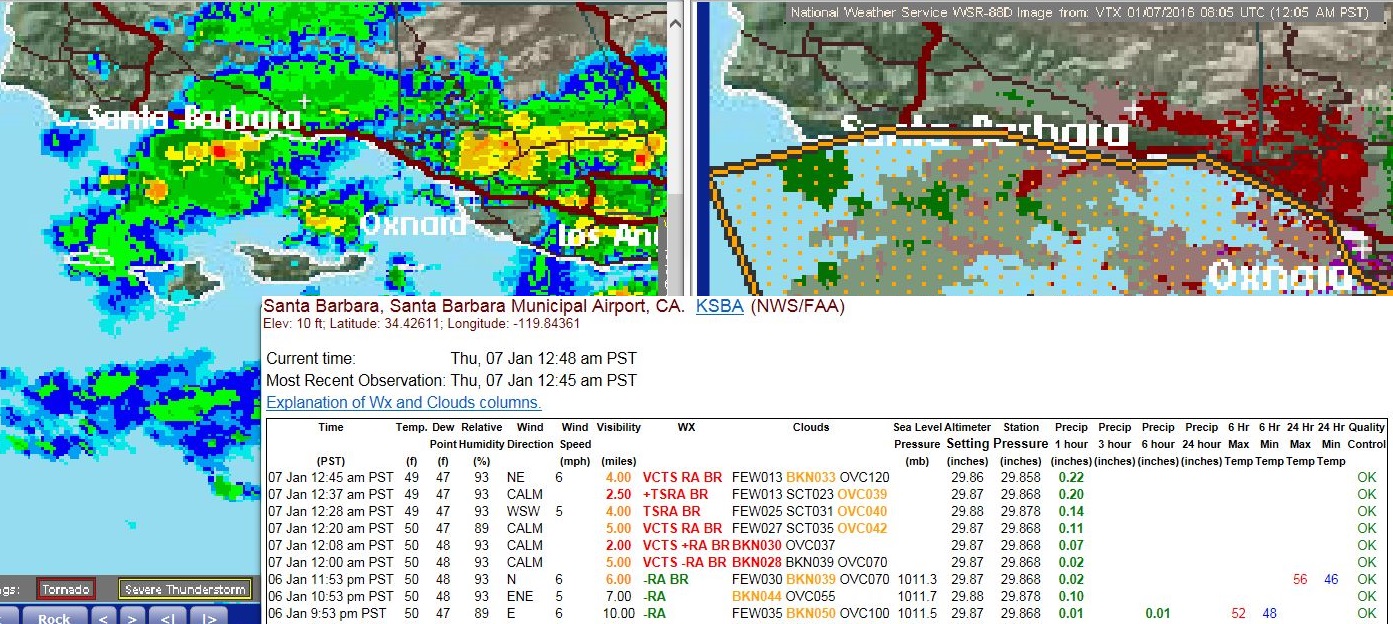
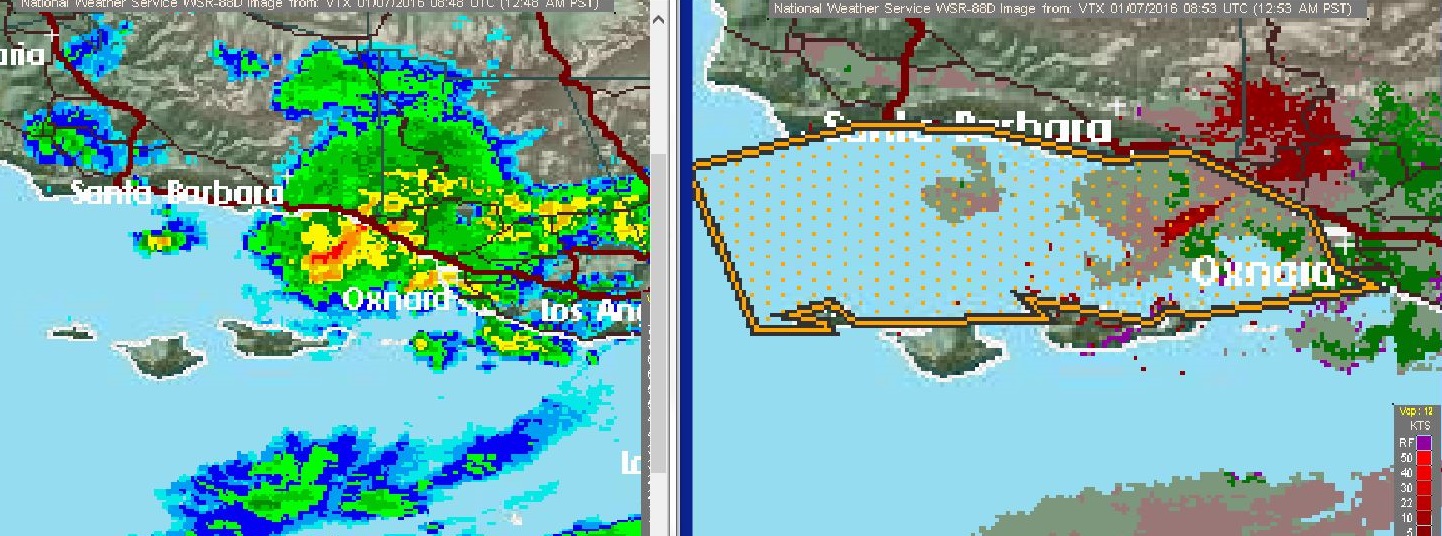
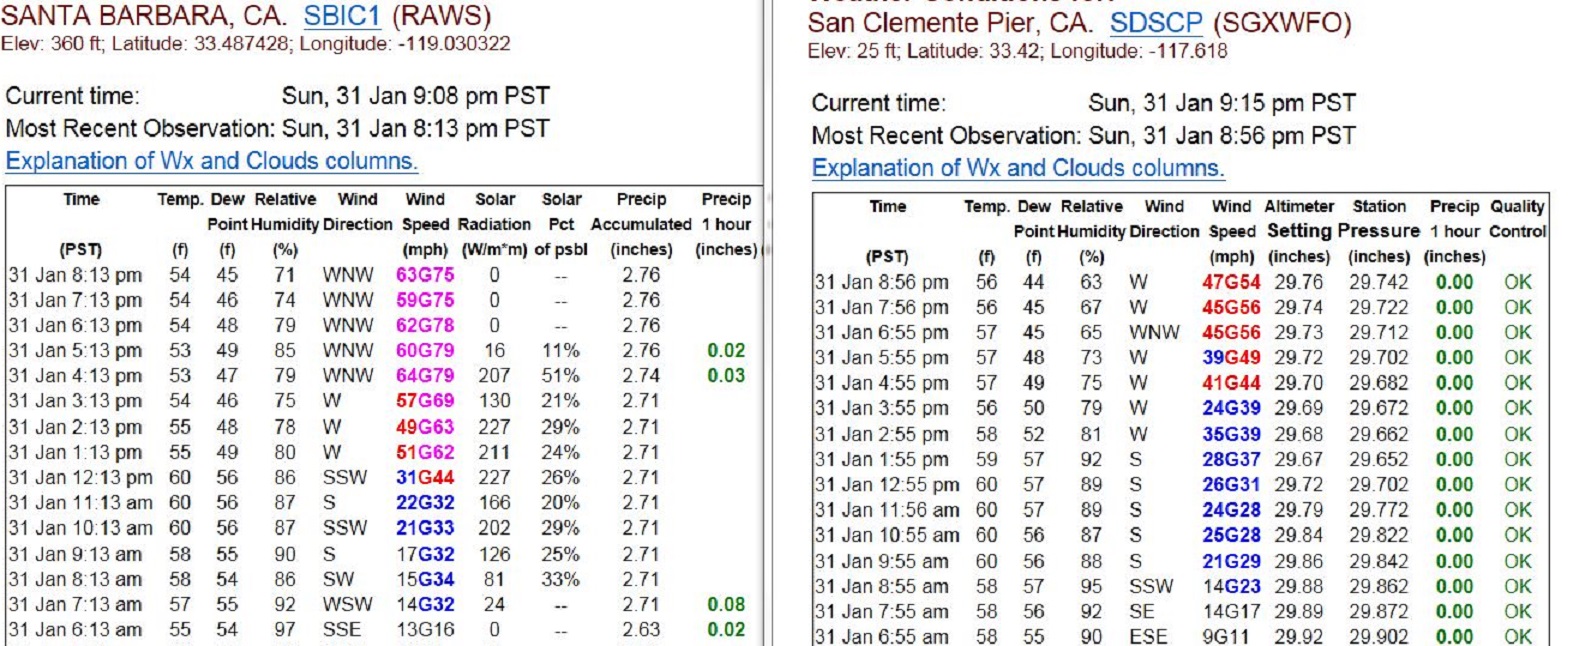
Southern California wind observations from Sunday January 31, 2016 showing the wind energy of our approaching weather system.
Santa Barbara Island gusting to 79mph. San Clemente gusting to 56 mph.
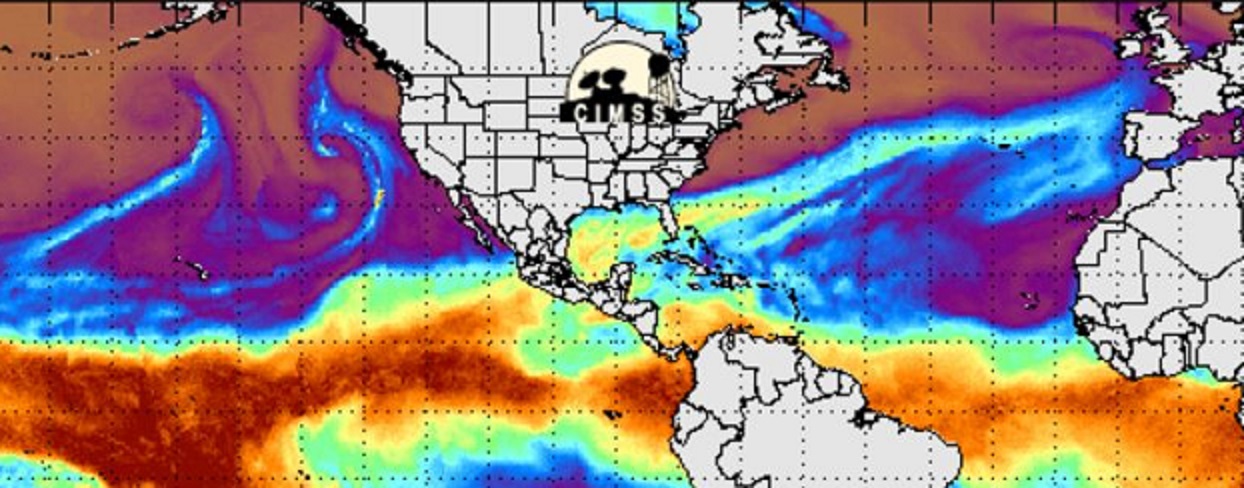
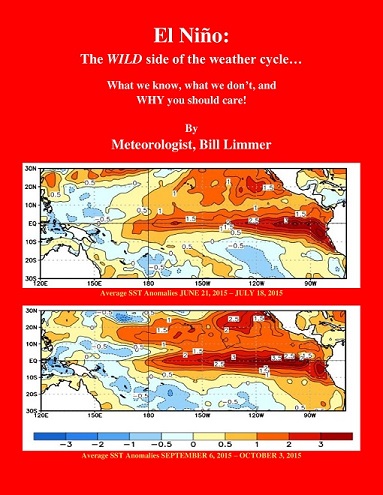
Floods, snowstorms, and tornadoes oddly enough are all in my latest e-book El Niño: The WILD side of the weather cycle…What we know, what we don’t, and WHY you should care!
I show how this years Pacific water temperatures compare to the 1983 and 1998 events and highlight the kind of weather episodes that these stronger El Niño’s tend to bring.
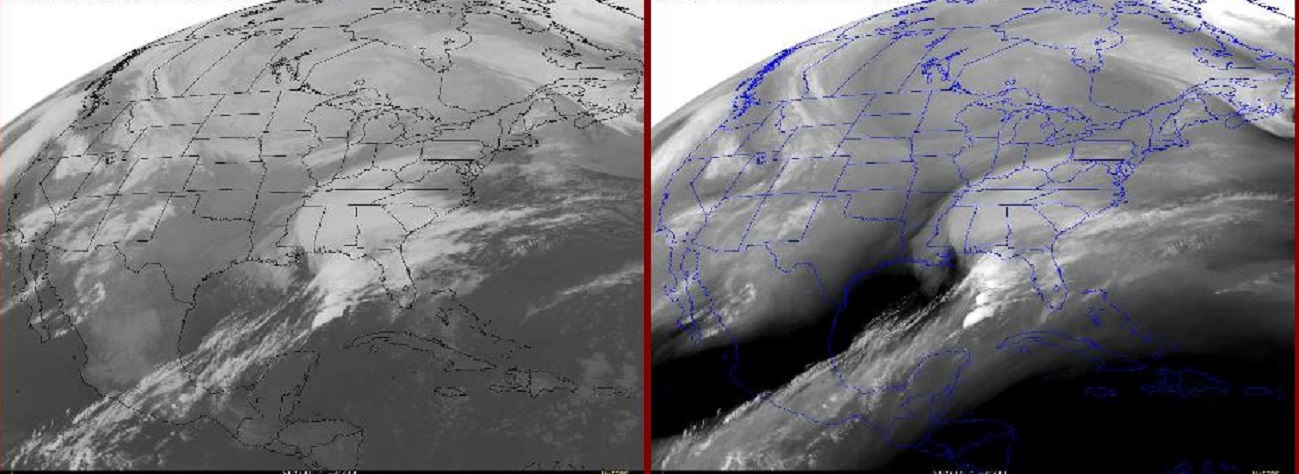
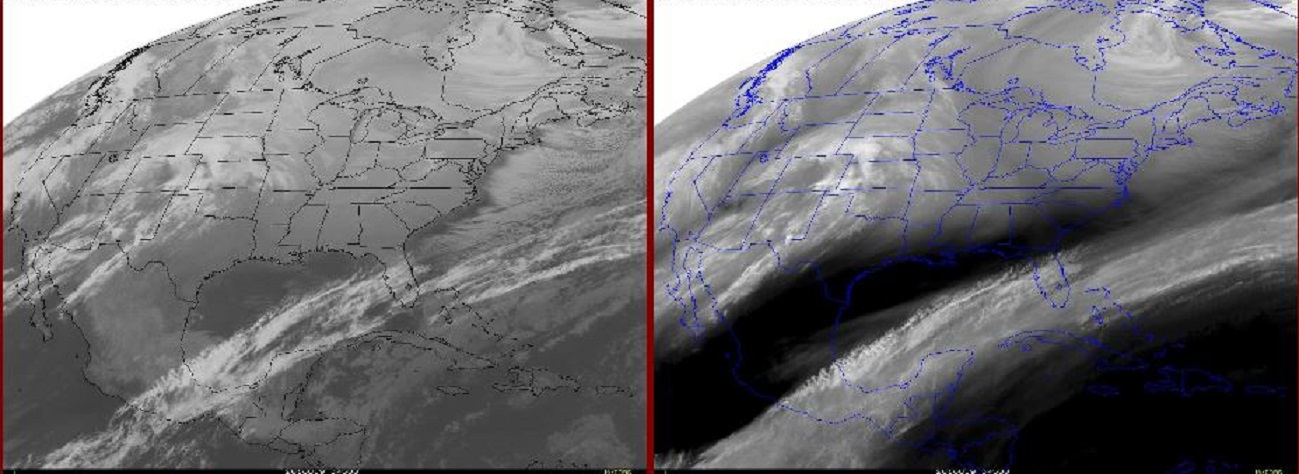
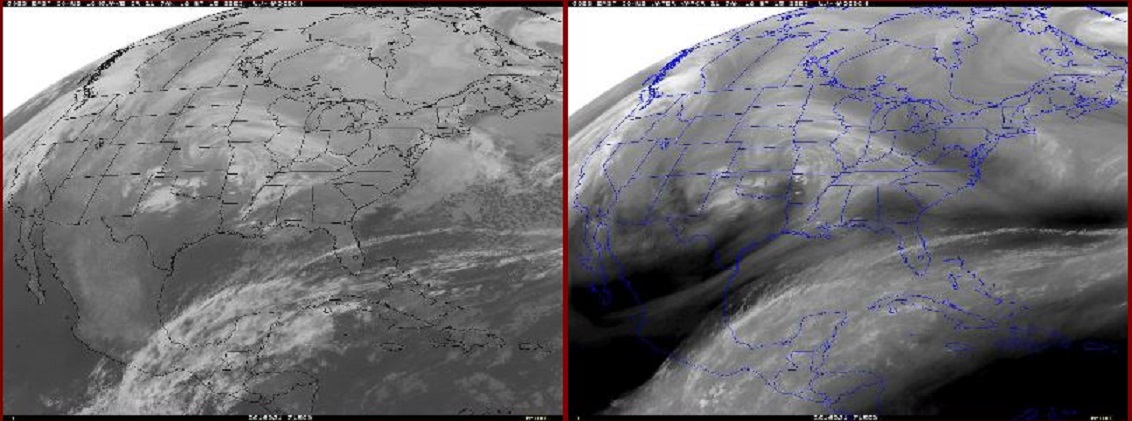
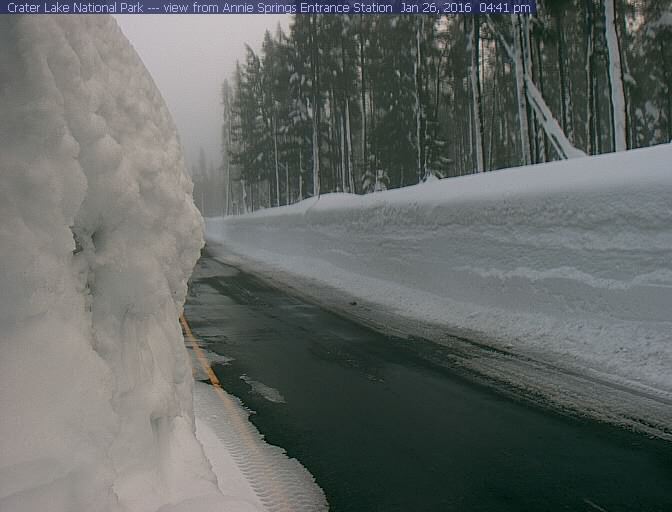
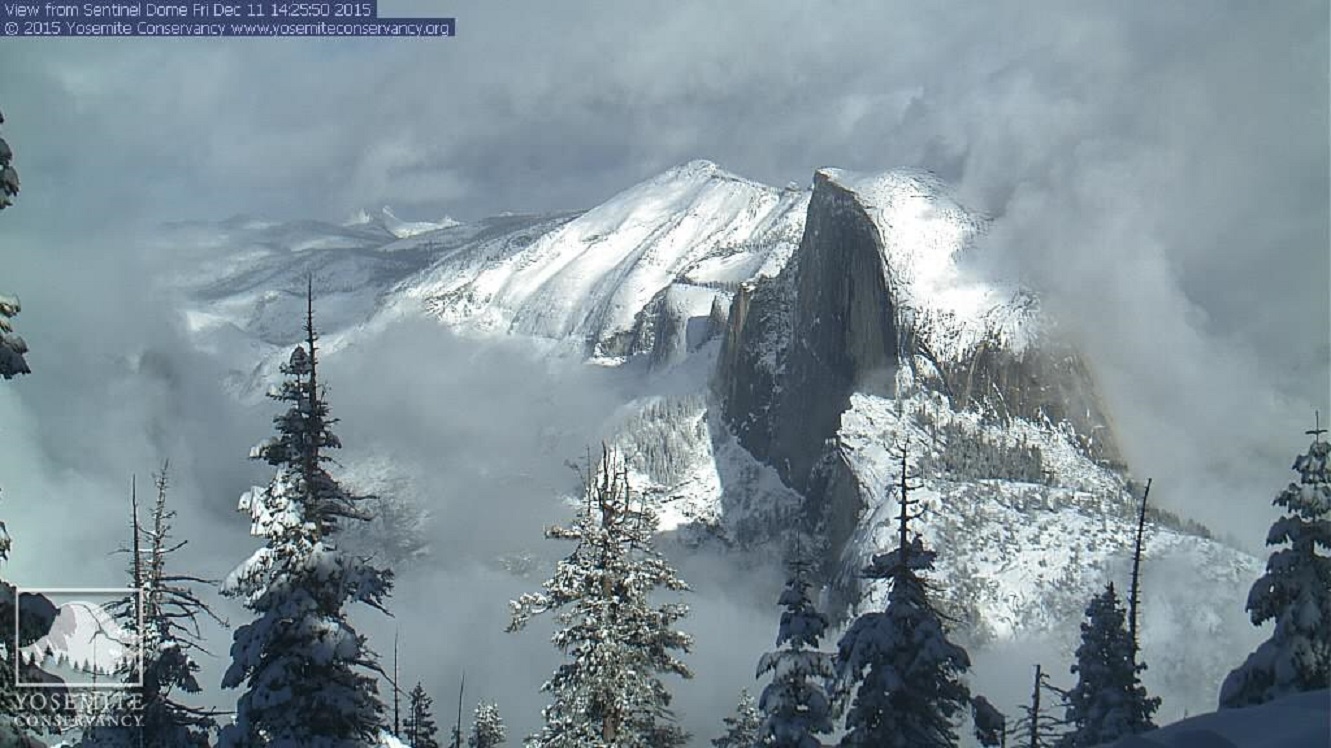
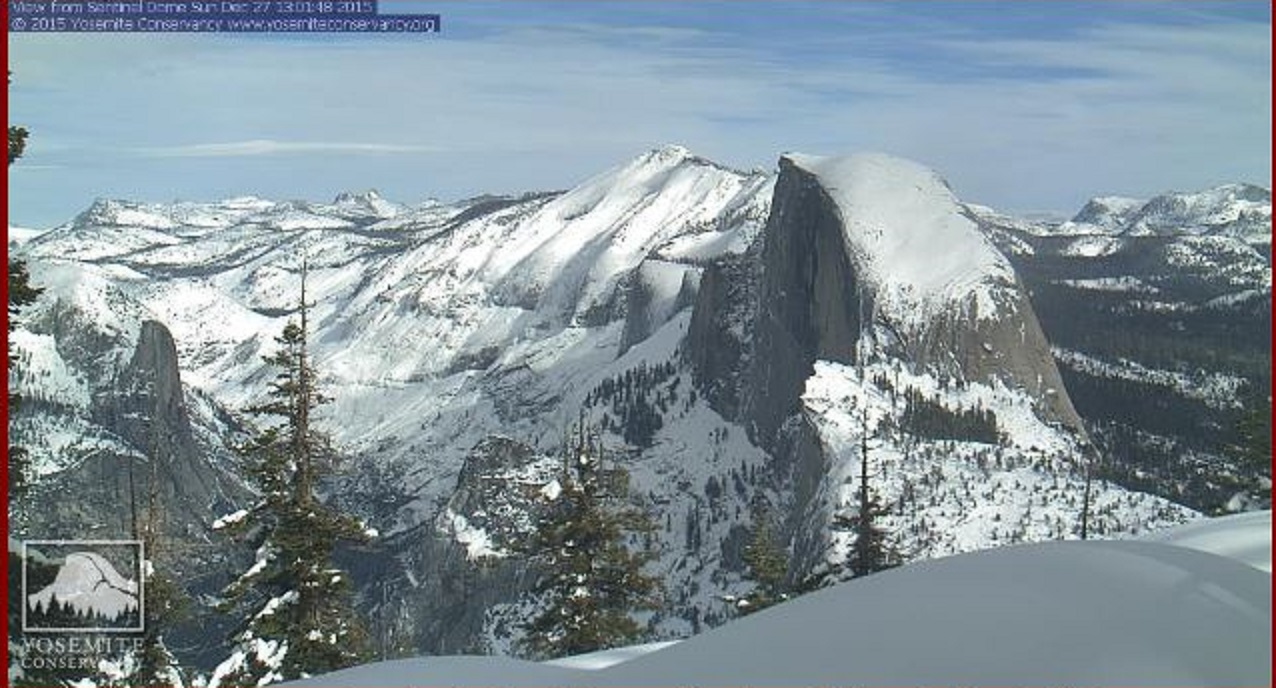
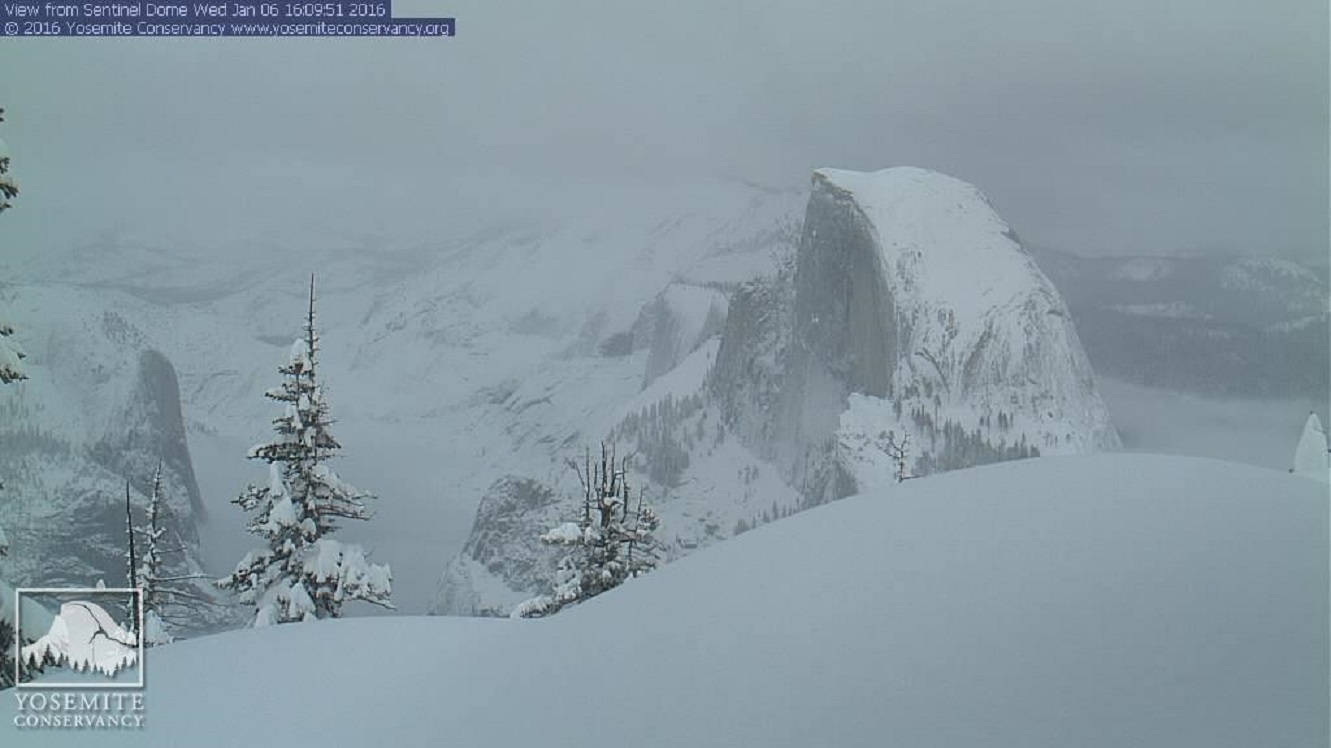
El Niño at work, increase in cloud over the High Sierra.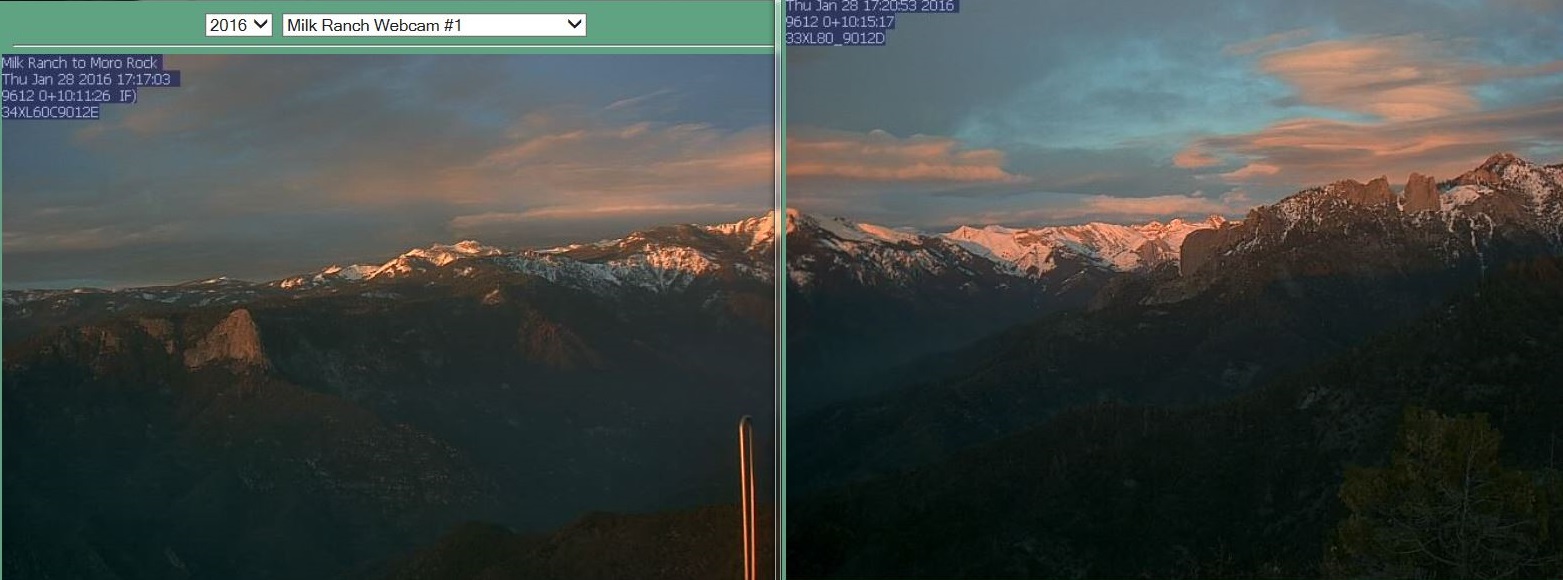
If you like the blog you will love the book.

Wild Bill.