November 26, 2015
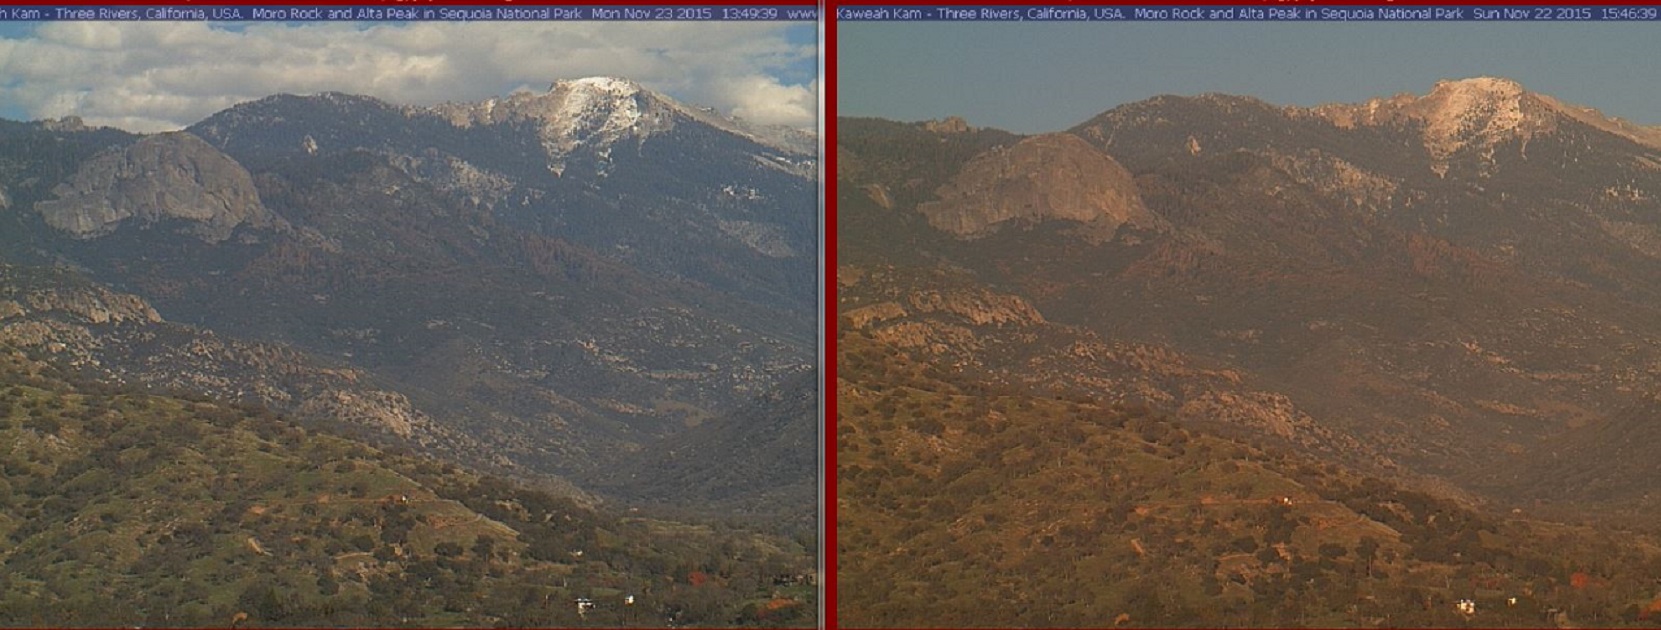
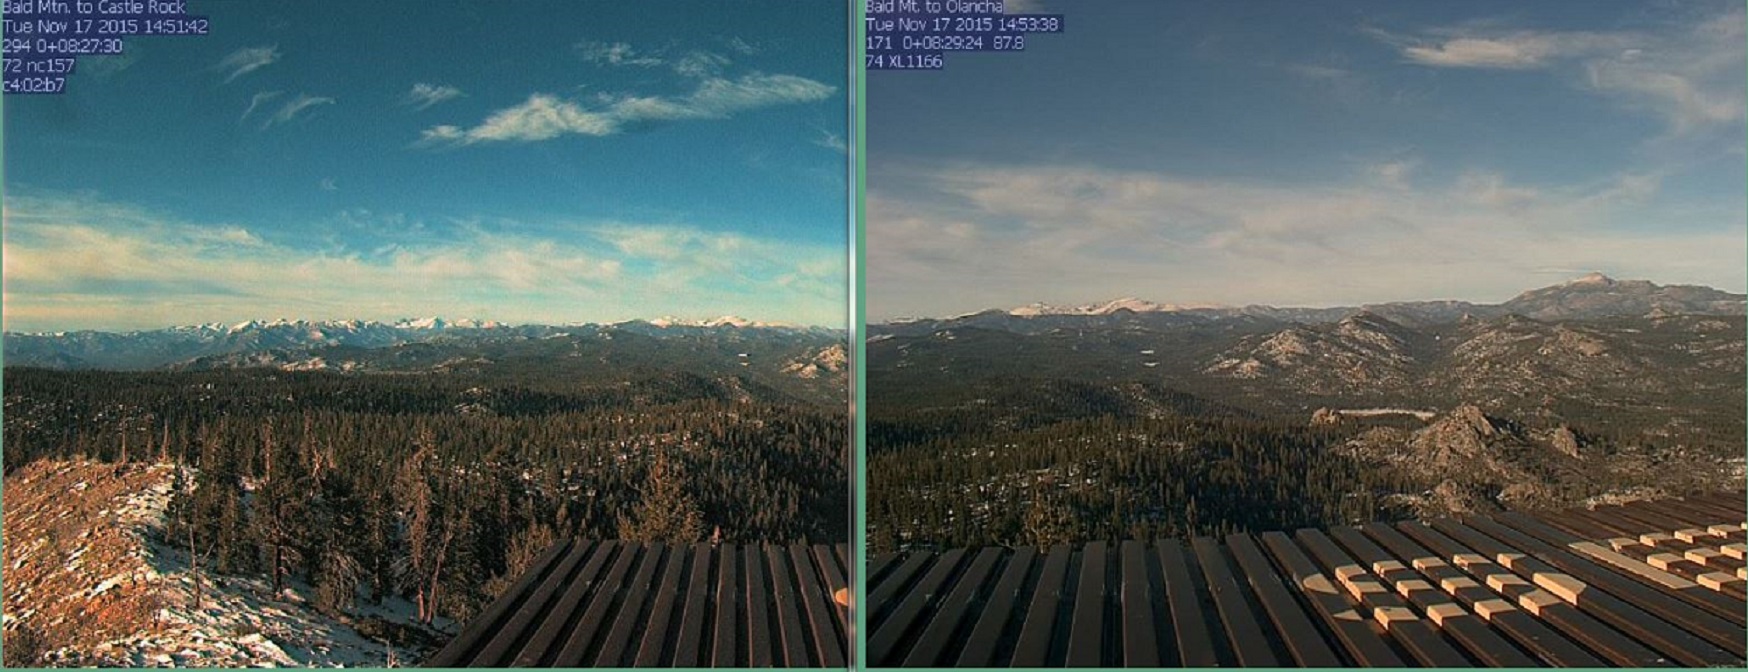
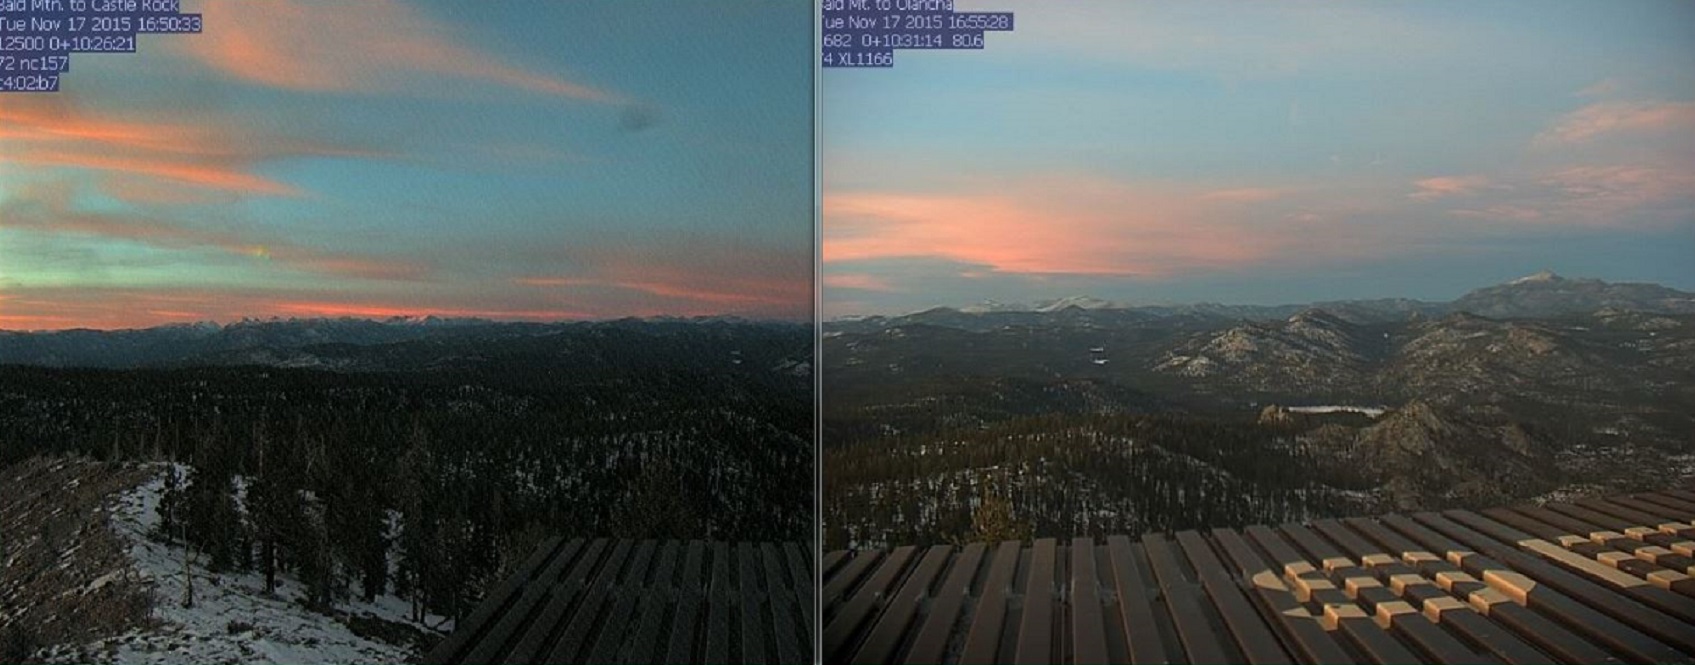
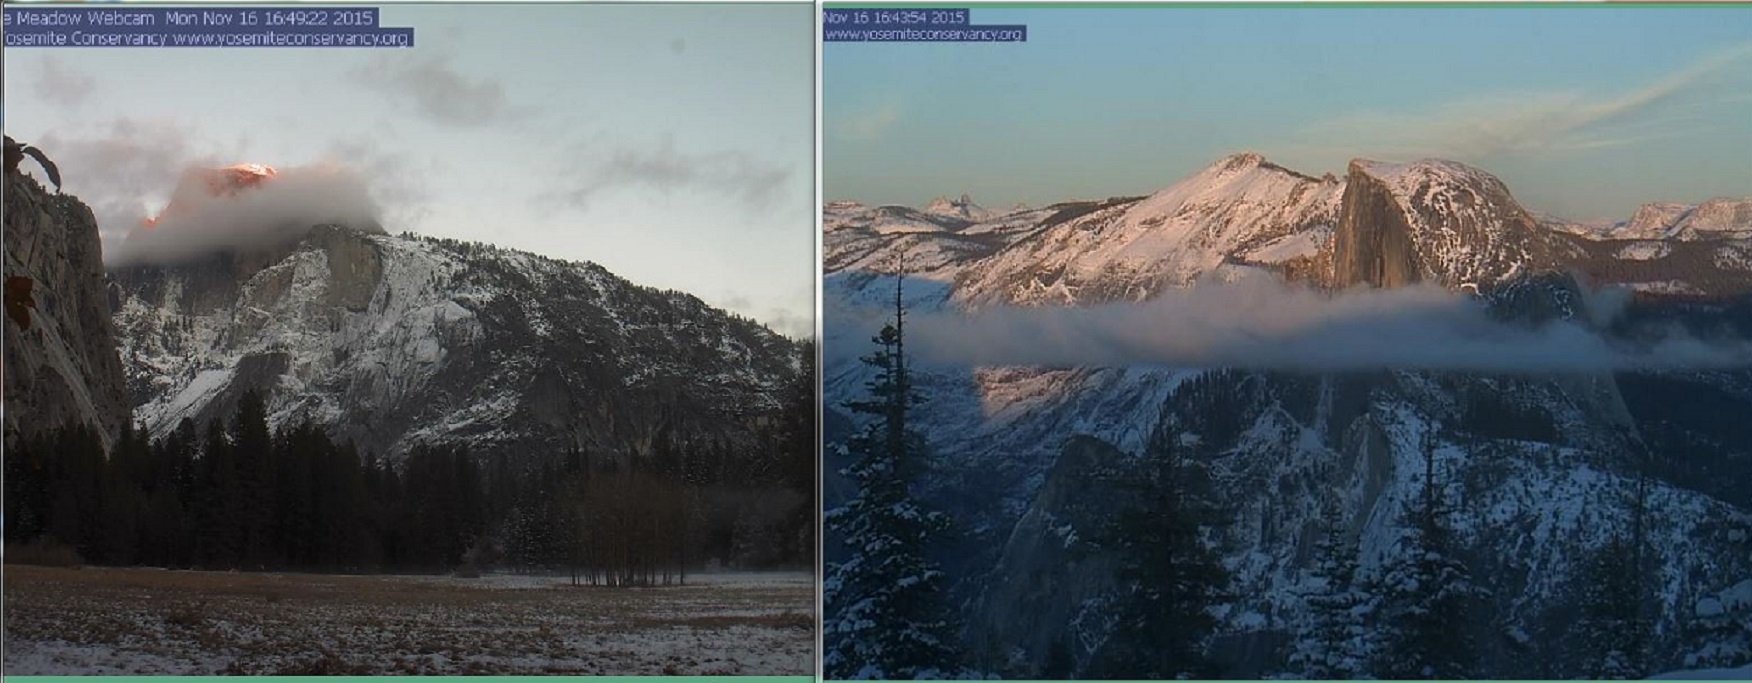
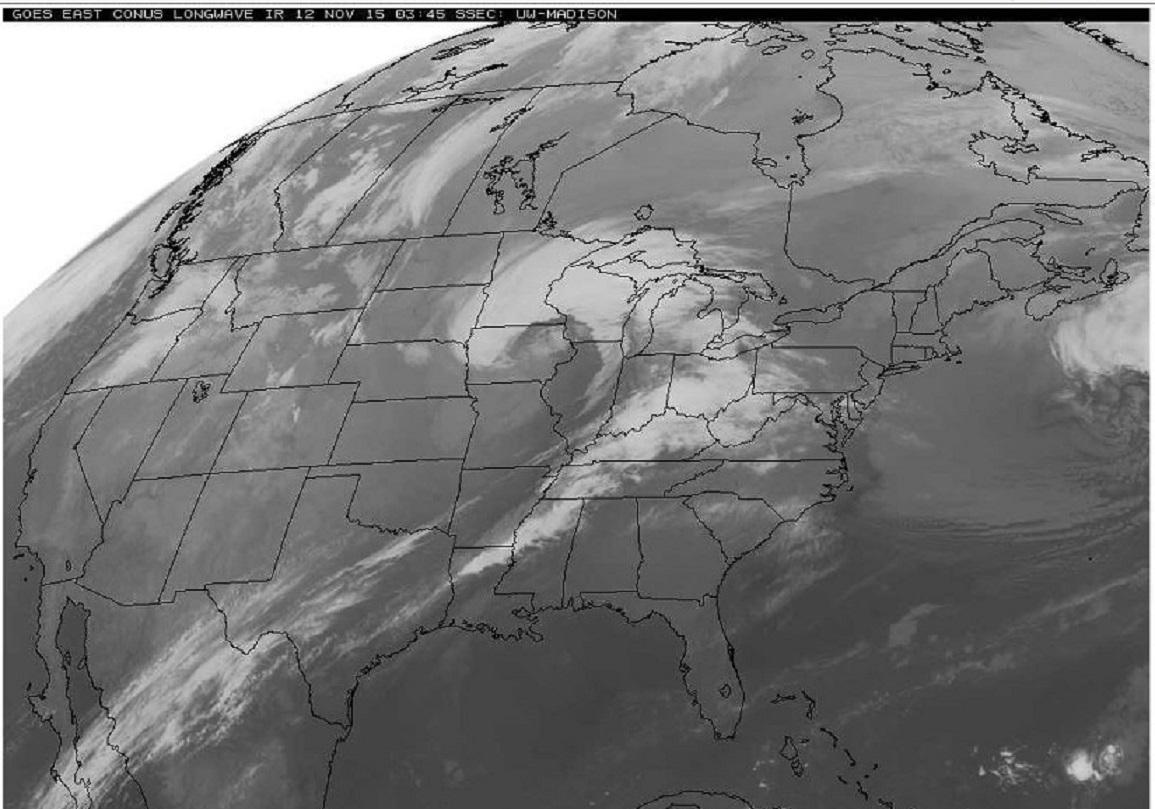
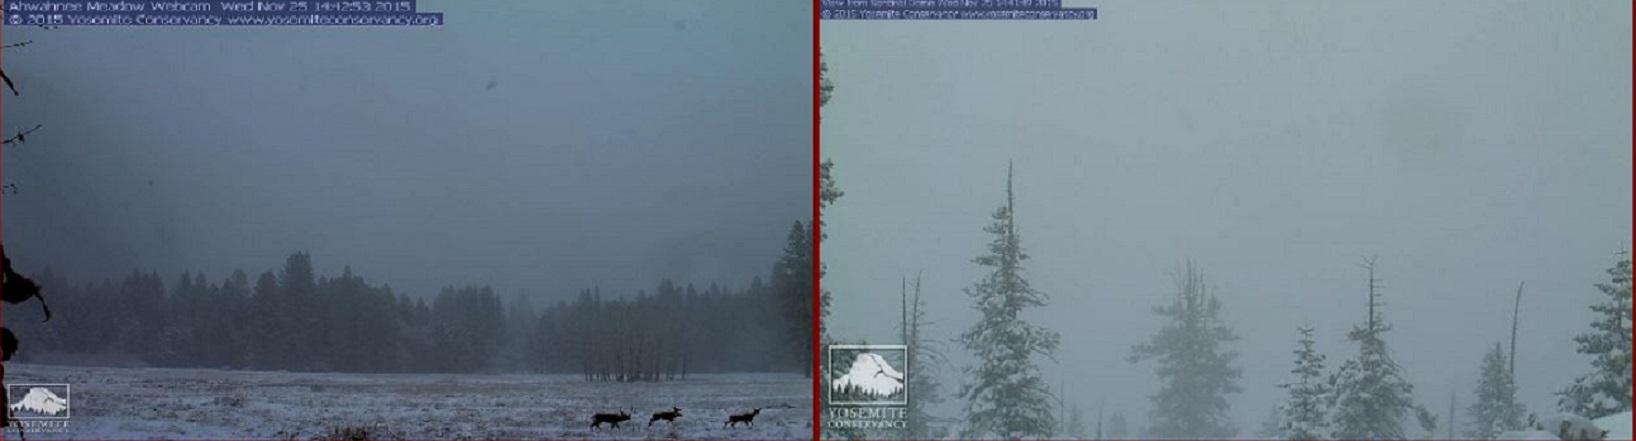
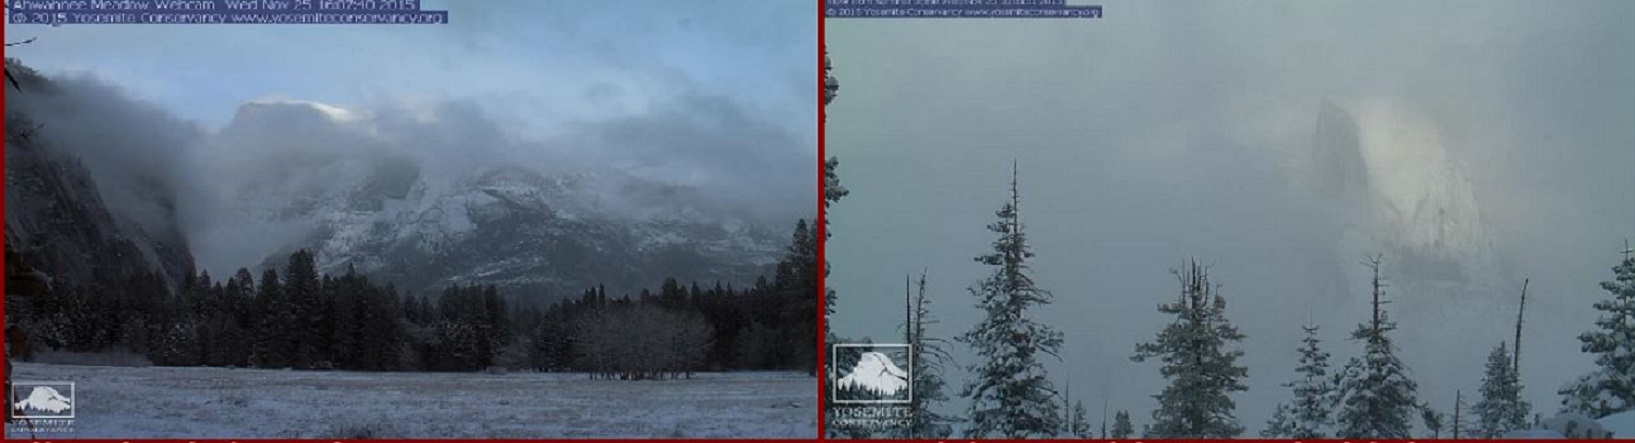
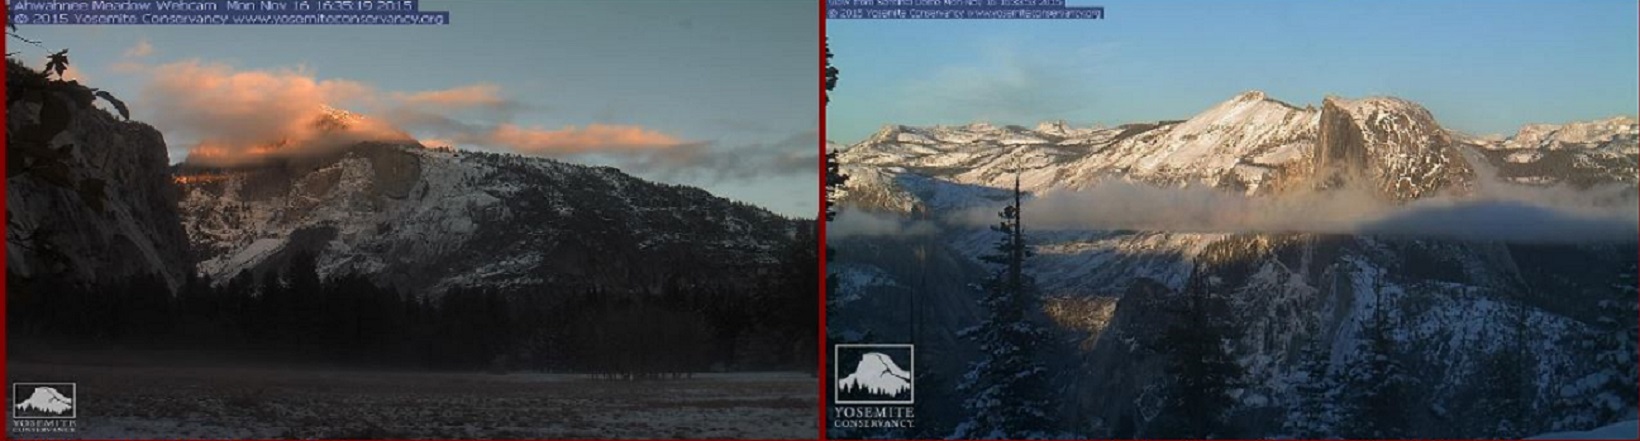
- May this series of pictures be a metaphor for the Holiday, while its good to be comfortable in the fog of your immediate surroundings, what wonders and perhaps dangers are revealed when our vision clears.
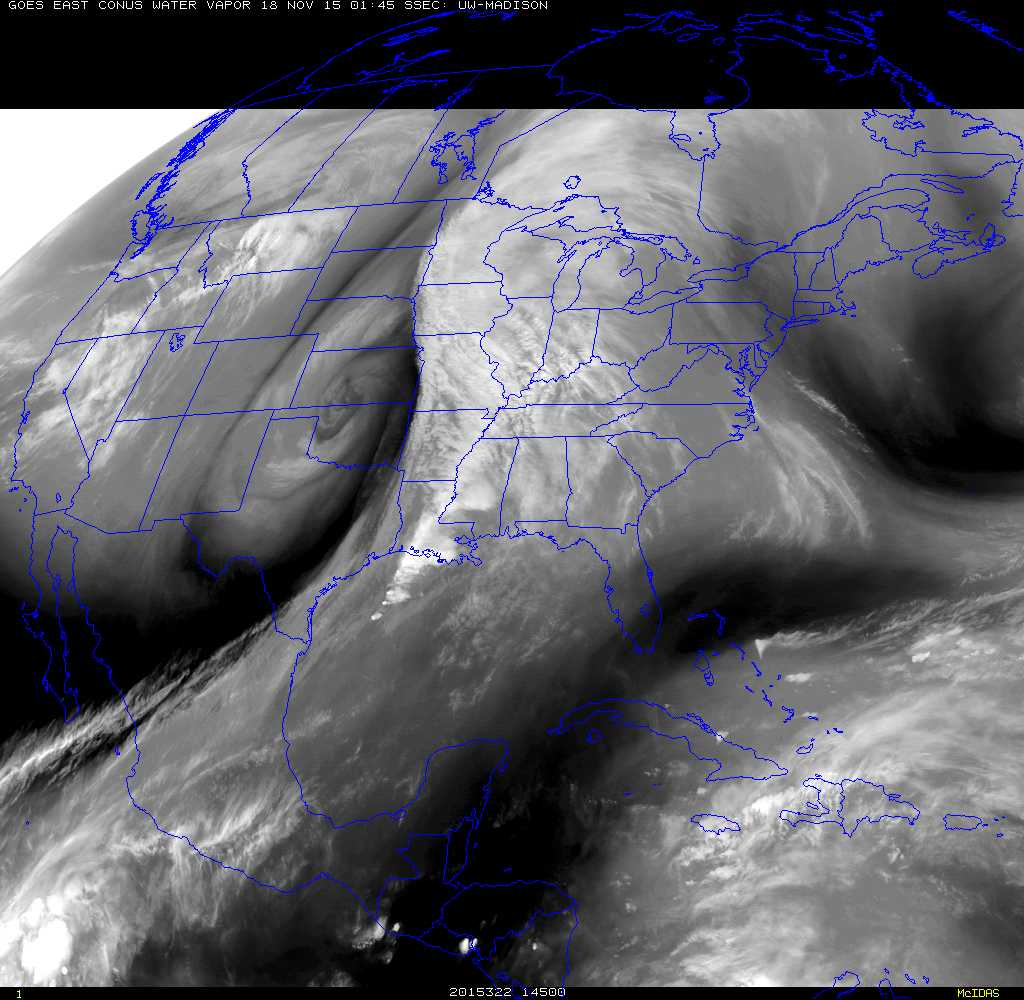
2a. Models continue to tease a stormy weather pattern for much of the West Coast. Not exactly the much hyped “pineapple express atmospheric river” event yet . But still a series of wet and windy storms in the early days of December for much of the West Coast.
2b. 500millbar forecast above shows the air flow at mid levels of the atmosphere. Below, the surface, where we can track the highs and lows and monitor moisture distribution. With a brisk river of air flowing straight across the Pacific, the early targets are appear to be the Pacific Northwest and Northern California. This is a forecast map for Thursday the 3rd. Recent model runs tend to hold off significant Southern California rain until the following week so stay tuned. Just like, it is not really winter in the East until it snows in New York City. In the sphere of public opinion, It is really not a big El Niño verification until the streets look like rivers in Los Angeles and San Diego and that is not in the forecast in the map below. So we watch and wait.
3. It is the 65th Anniversary of the Great Appalachian Storm. Definitely a noteworthy storm. It is remembered for the coldest November temperatures in the south, single numbers in Birmingham and Atlanta. It is remembered for 100 mph winds in New Jersey and New Hampshire. And for some it was a blizzard, over 30 inches of wind blown snow paralyzed portions of Ohio and West Virginia.
In November of 1950 the ONI was -0.7 indicating La Niña.
Below 500millbar jet steam flow and old time surface map for November 26, 1950.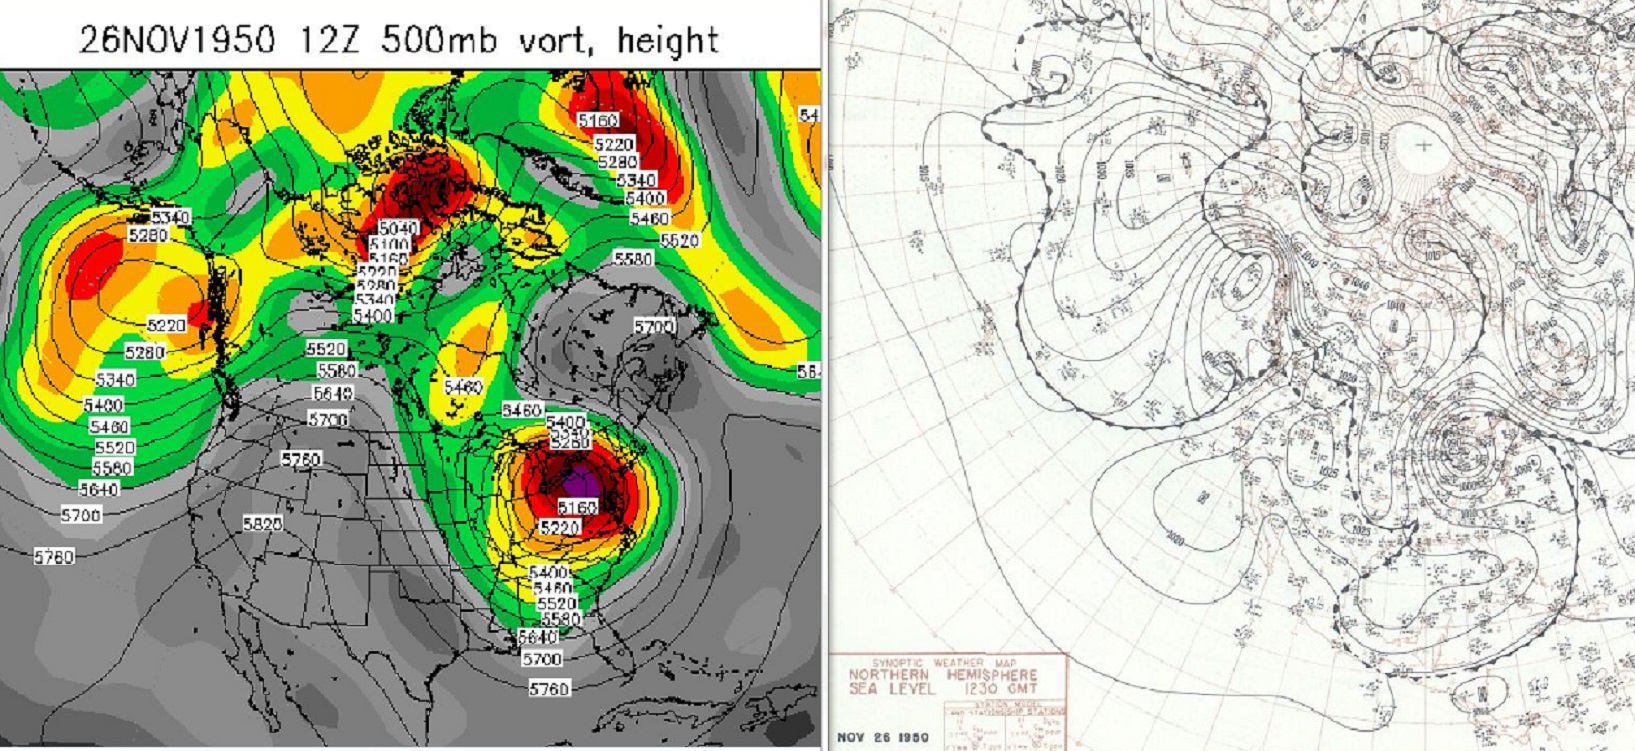
4. During the colder weather season snowfall tends to take place near or under such “bubbles ” or “cutoff lows” in the jet stream flow as shown with the historic storm above.
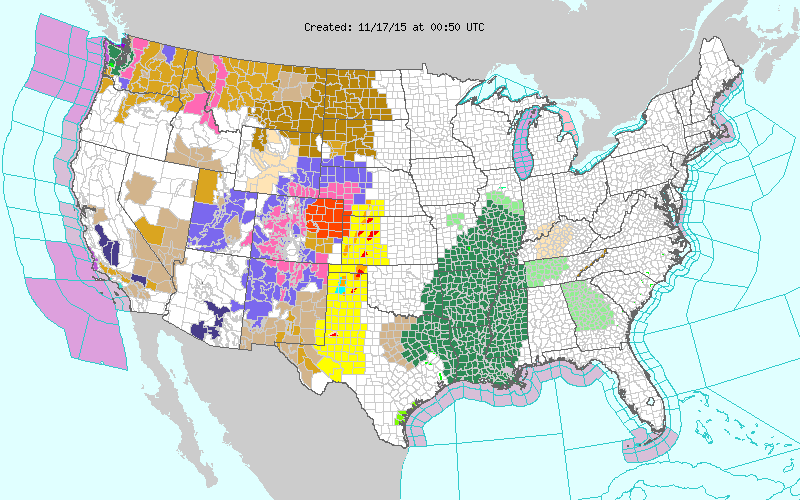
Below, the current 500millbar chart would suggest more snow on this Holiday across the Great Basin and portions of the Intermountain West.
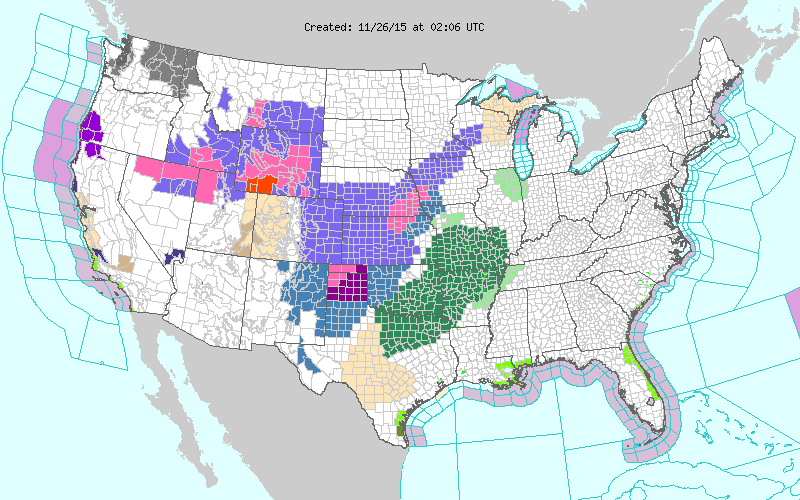
5. A very busy chart below, please be careful if you must travel this Holiday.
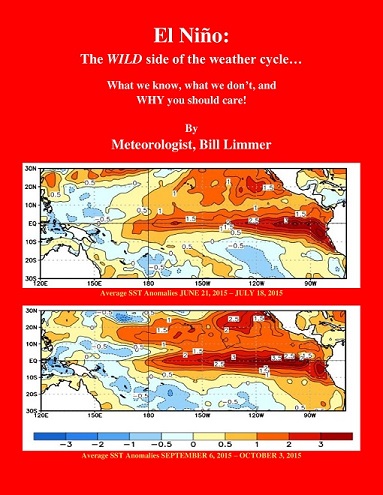
Learn more in my latest e-book El Niño: The WILD side of the weather cycle…
What we know, what we don’t, and WHY you should care!
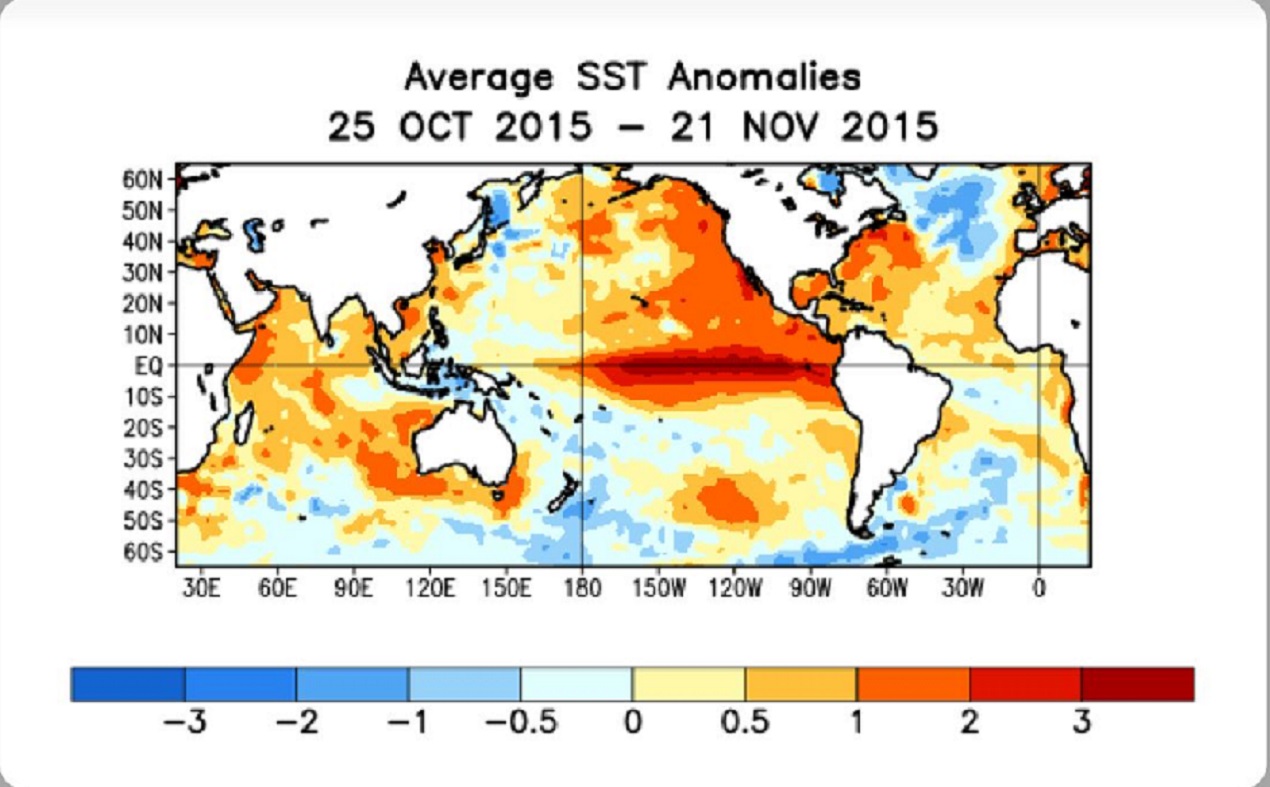
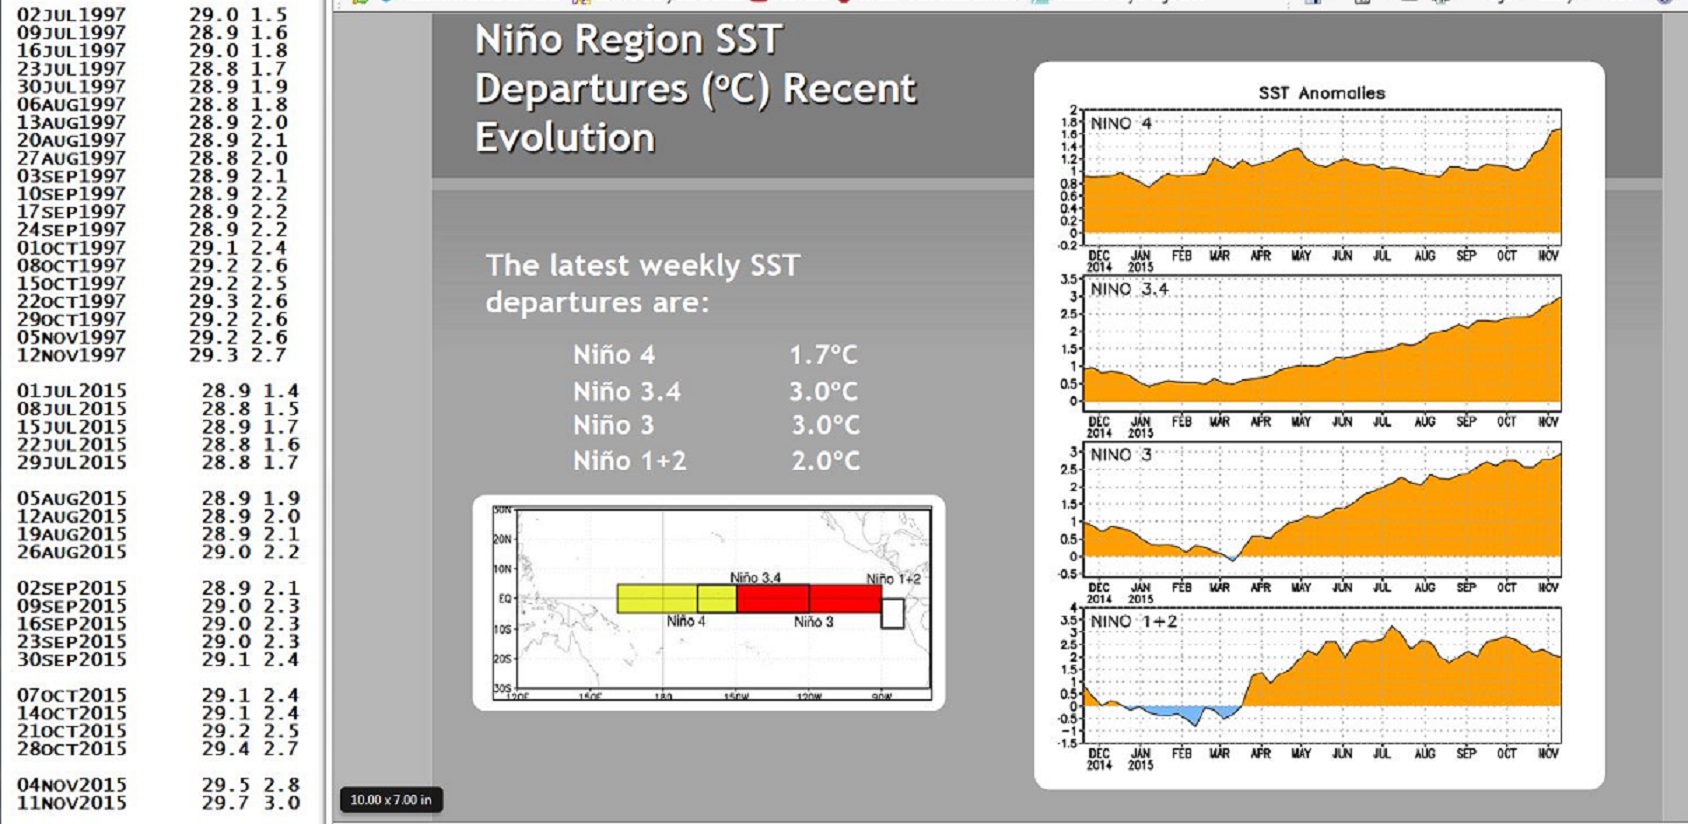
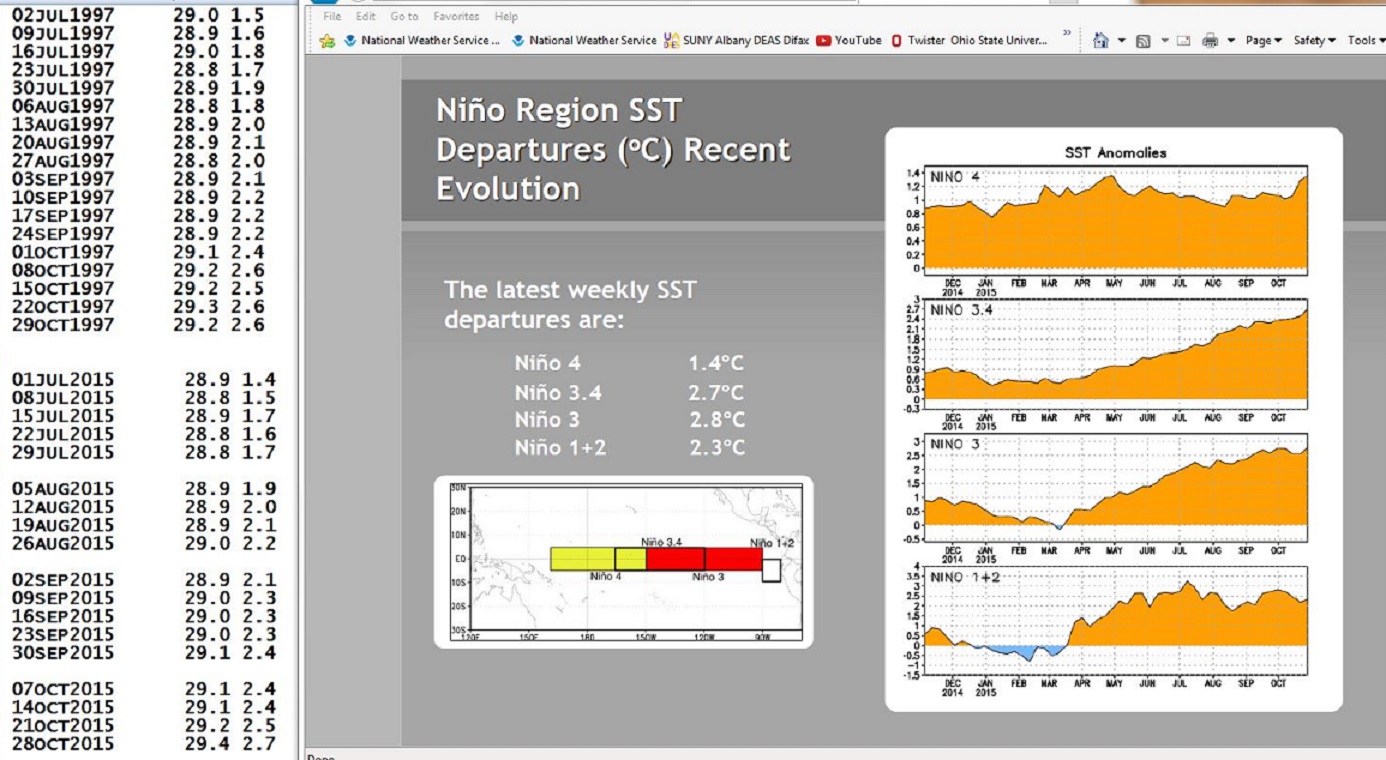
I show how this years Pacific water temperatures compare to the 1982 and 1997 events and highlight the kind of weather episodes that these stronger El Niño’s tend to bring.
If you like the blog you will love the book.
Wild Bill