November 24, 2015
The weekly sea surface temperature anomalies posted for the week of November 18 continue to climb in the 3.4 Niño region of the Pacific. This year’s sea surface temperatures have surged ahead of the record pace of 1997 El Niño .
04NOV2015 29.5 +2.8 05NOV1997 29.2 +2.6
11NOV2015 29.7 +3.0 12NOV1997 29.3 +2.7
18NOV2015 29.7 +3.1 19NOV1997 29.3 +2.7
A +3.1 is a most extraordinary weekly reading. It will mean a lot more if this extremely high reading will linger for the next two or three months. If these extreme anomalies do last through January into February, it will be a very interesting winter indeed.
Map below clearly illustrates the El Niño warming stretching for 6000 miles along the equator from the South American coast to near 180 degrees or the International Dateline.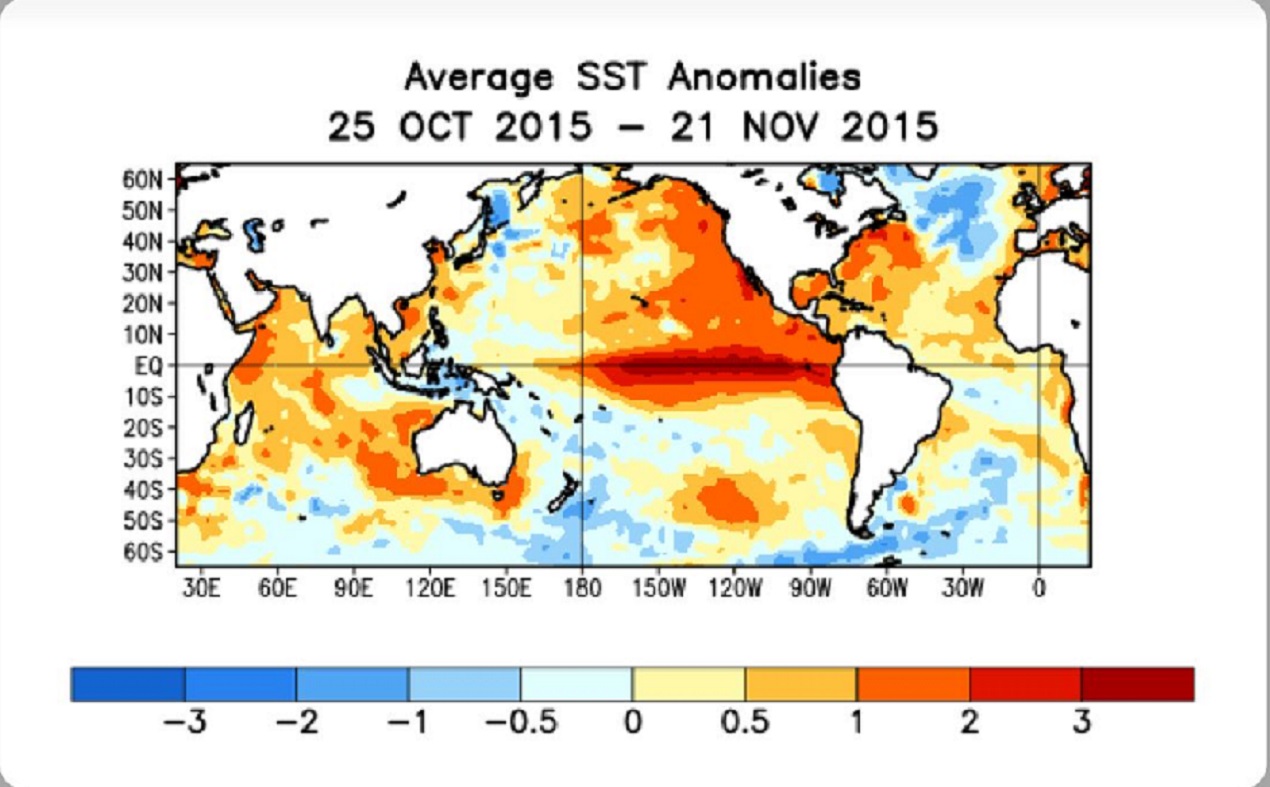
Current long range forecast showing signs of wetter weather pattern, an “atmospheric river” type configuration across the Pacific and into the West Coast including California.
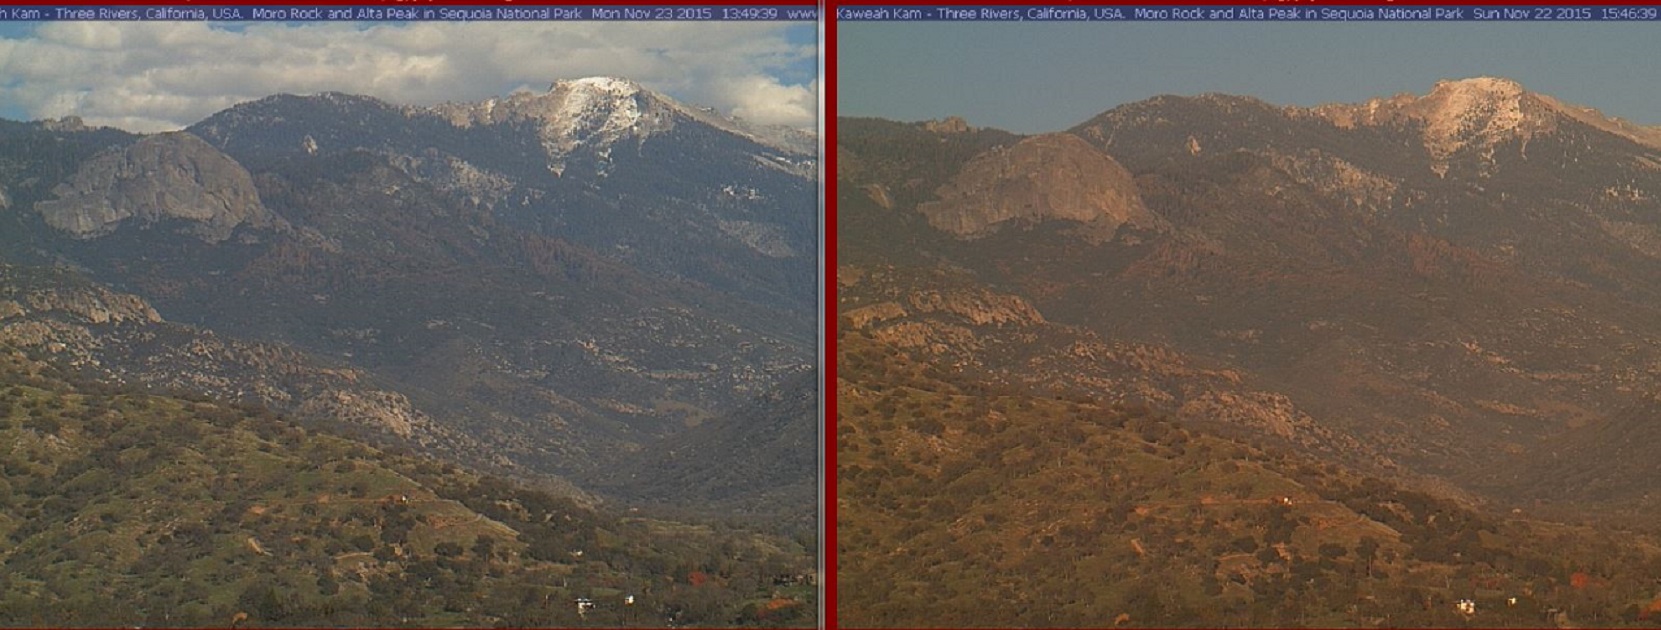
Despite a few healthy storms farther north, the Southern Sierra Nevada still look rather light on the snow cover. All this should change with the Holiday storm later this week and the pattern above developing by early next week. Note the green grass on foreground hills, a sign of some recent moisture.
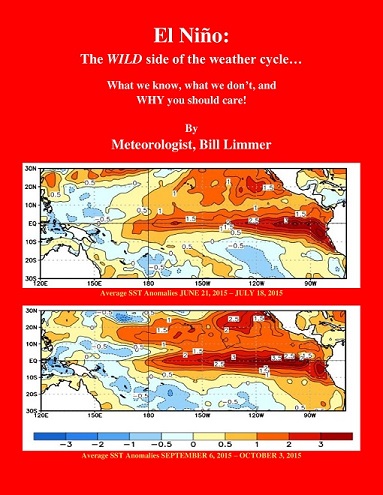
Learn more in my latest e-book El Niño: The WILD side of the weather cycle…
What we know, what we don’t, and WHY you should care!
I show how this years Pacific water temperatures compare to the 1982 and 1997 events and highlight the kind of weather episodes that these stronger El Niño’s tend to bring.
If you like the blog you will love the book.
Wild Bill