First a brief review, impressive display of large hail and flash flooding

October 16, 2015

First a brief review of The Monthly Diagnostic Discussion from The Climate Prediction Center. This discussion was released on October 8 and is posted on the CPC website.

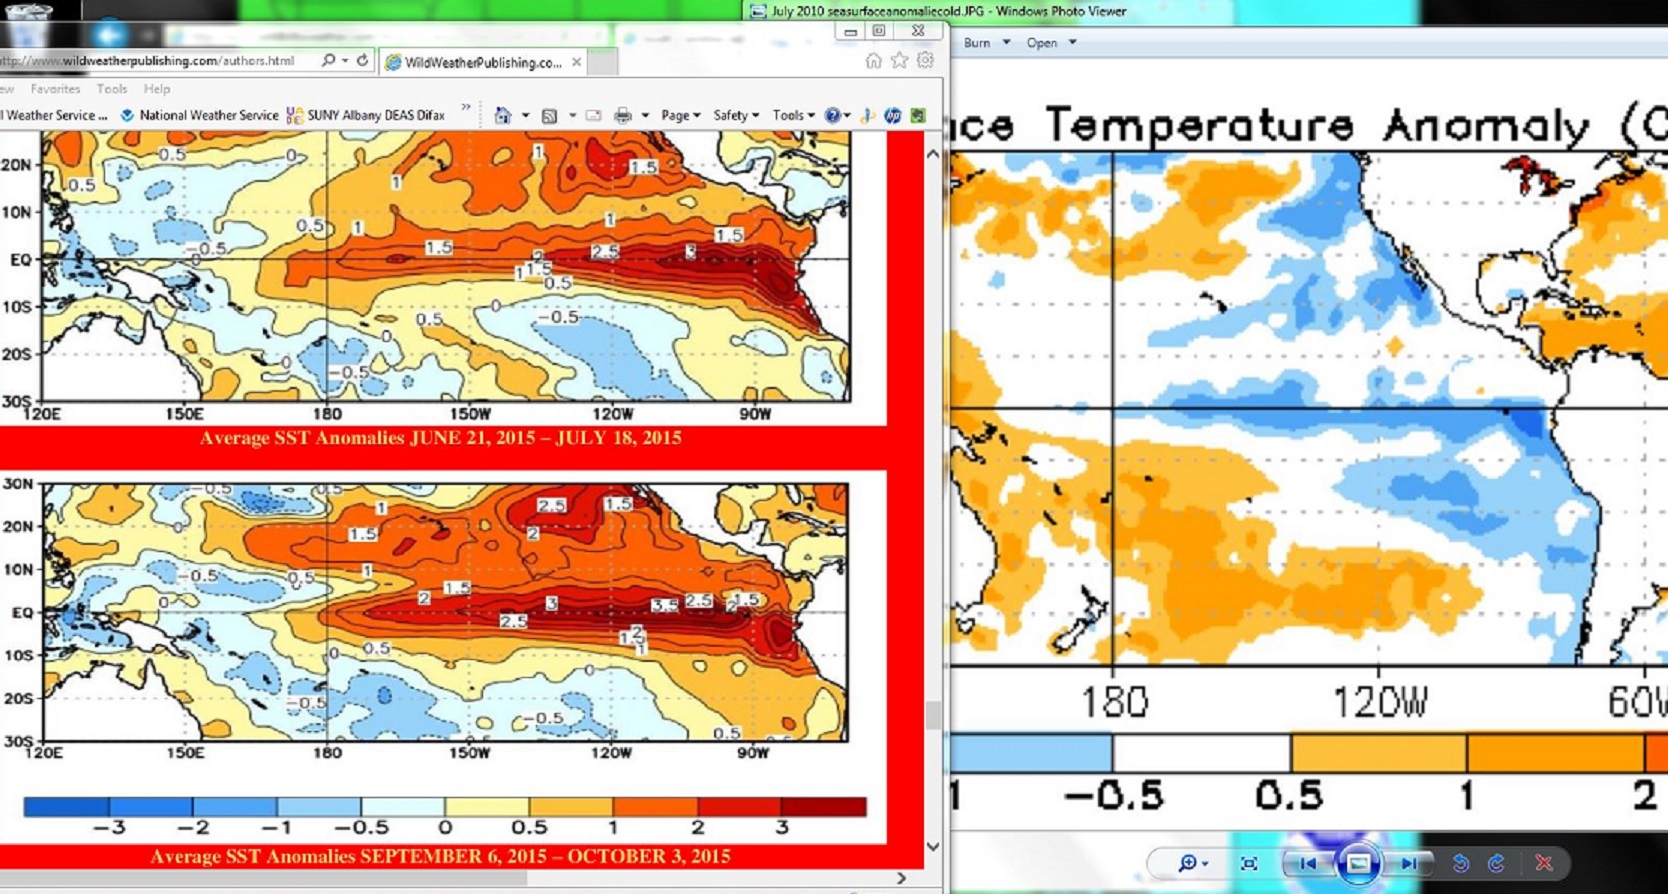
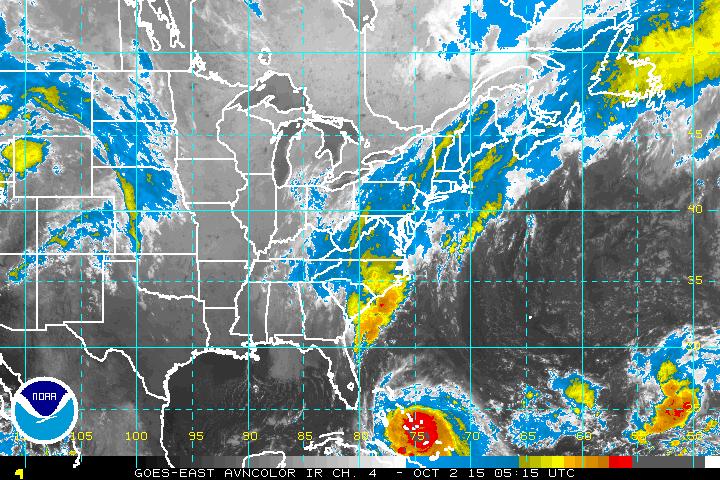
“During September, sea surface temperature  anomalies were well above average across the central and eastern Pacific Ocean.  The Niño indices generally increased.  The atmosphere was well coupled with the ocean, the traditional and equatorial Southern Oscillation Index values became more negative, consistent with enhanced convection over the central and eastern equatorial Pacific and suppressed convection over Indonesia. Collectively, these atmospheric and oceanic anomalies reflect a strong El Niño.  All models surveyed predict El Niño to continue into the Northern Hemisphere spring 2016.”

Once again, strong words from a government institution that usually stresses caution and discourages over reaction.

So this is serious stuff, even our conservative government specialists cannot deny the alarming warmth of the central and eastern Pacific or the potential for countrywide impacts this winter.

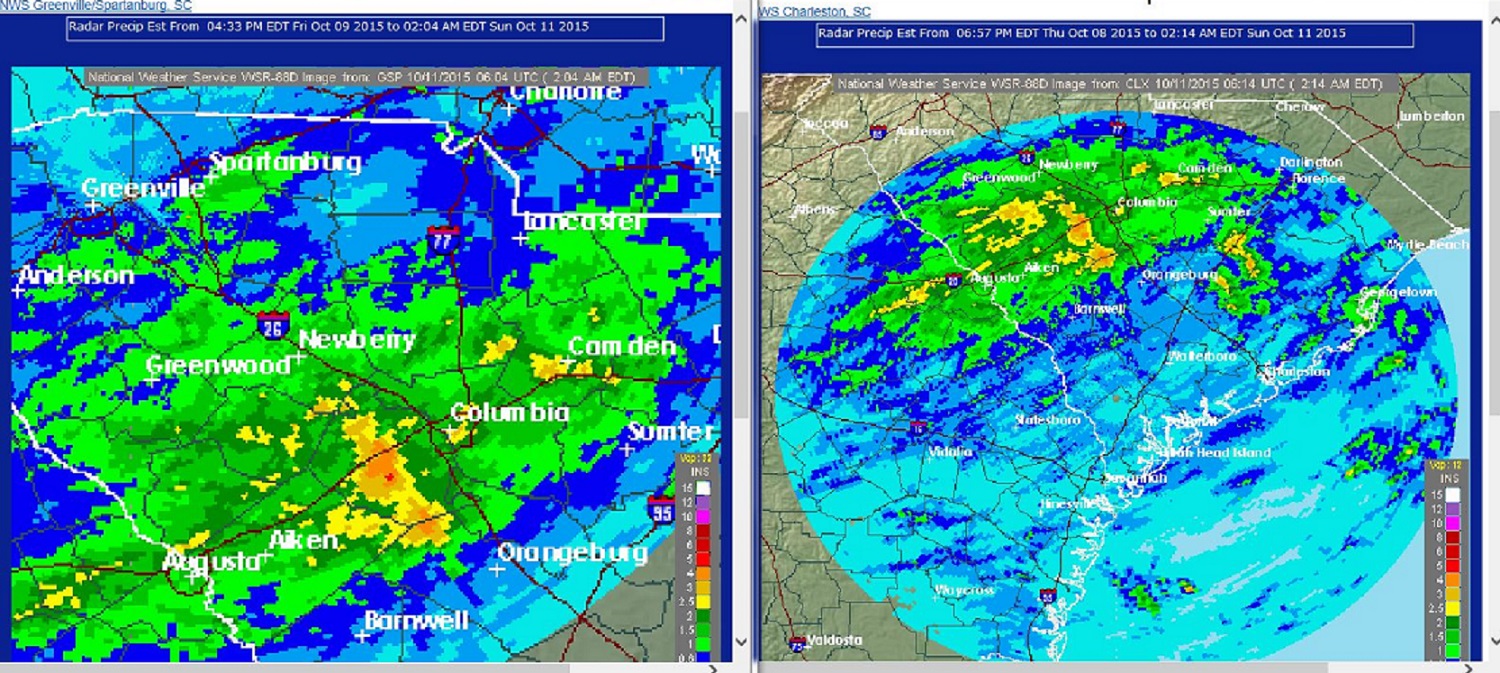
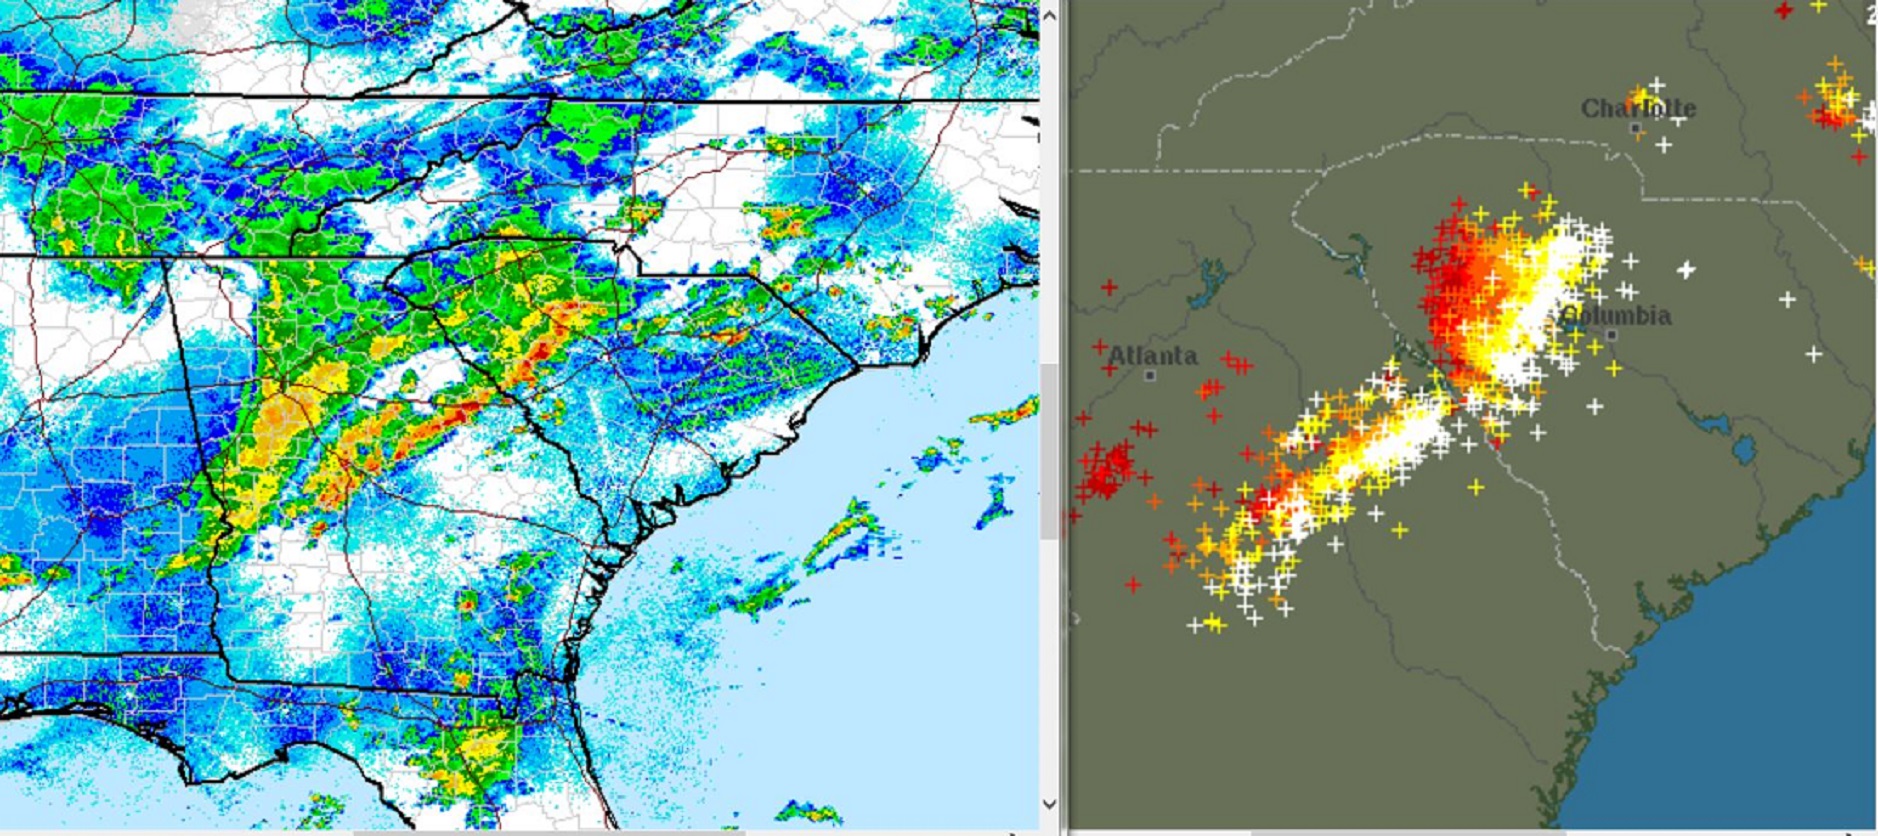
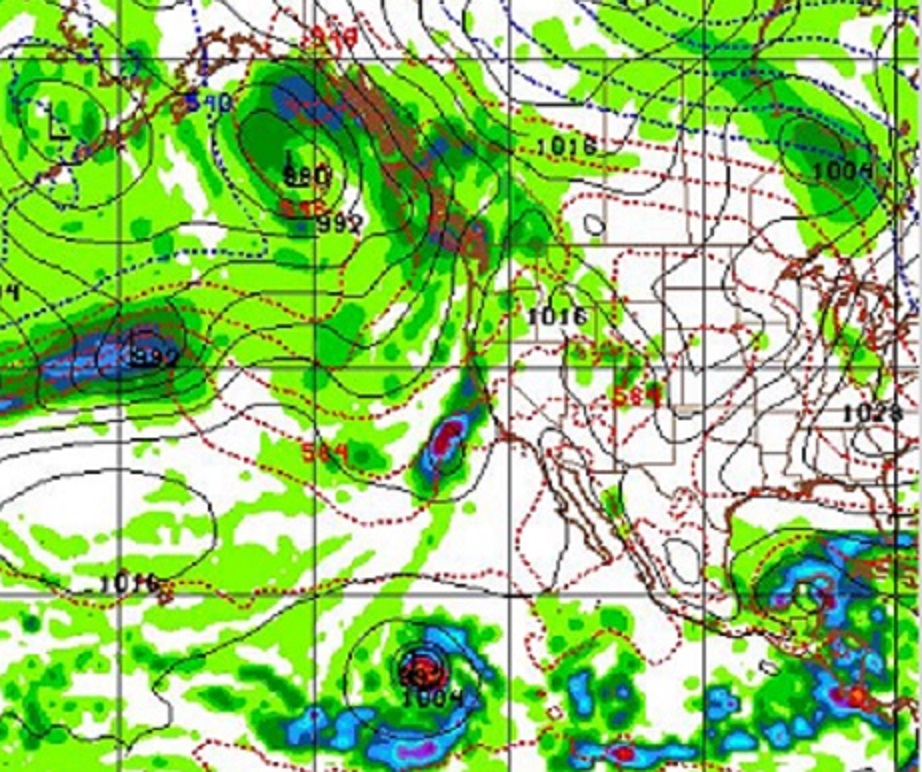
Despite a relatively quiet current weather pattern across most of the nation on Thursday, slow moving thunderstorms put on an impressive display of large hail and flash flooding in Northern Los Angeles County.

October 15, 2015californiaflashfloodradar1JPG - Copy

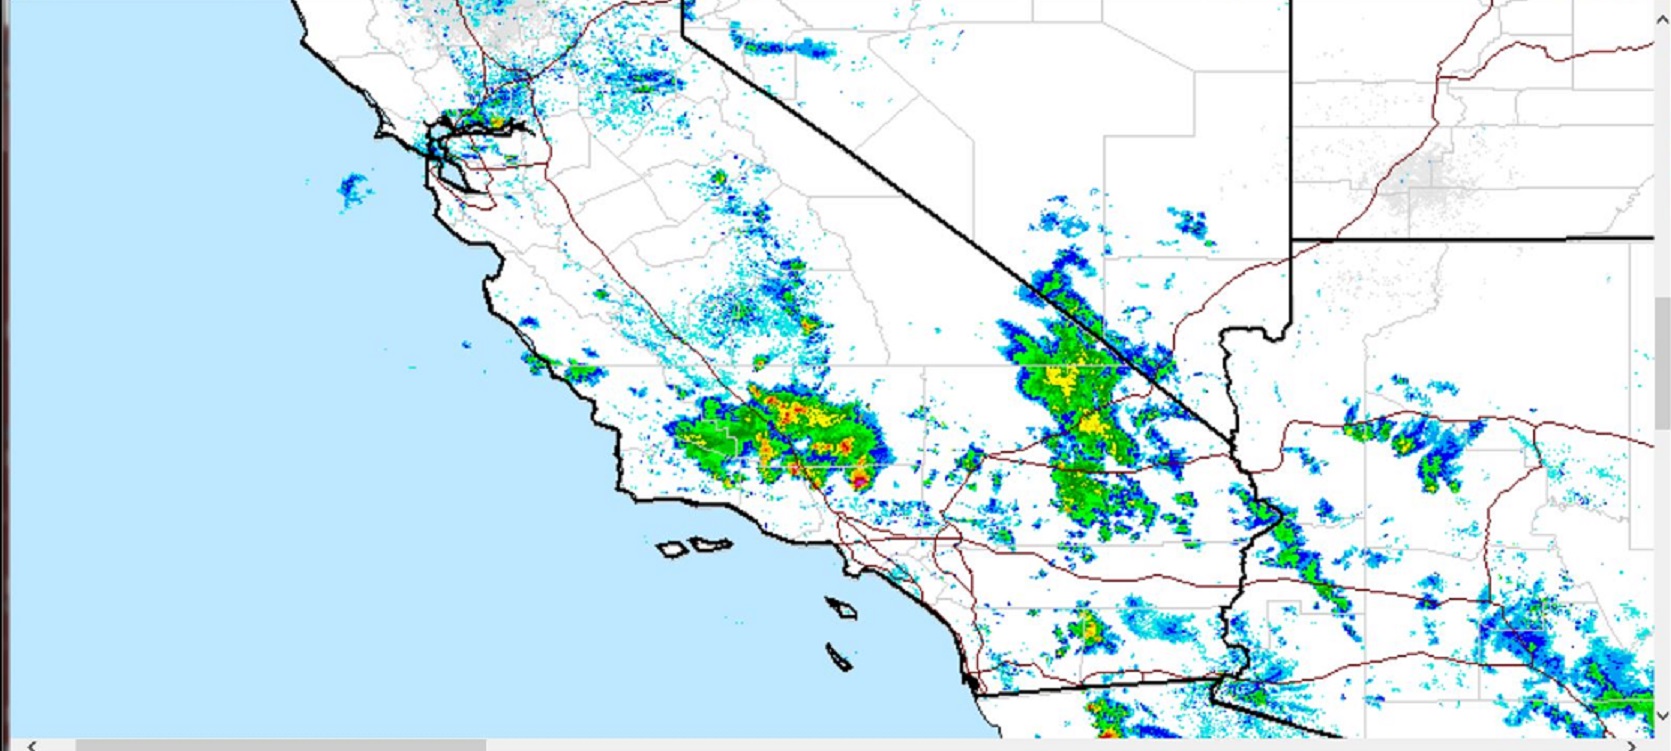
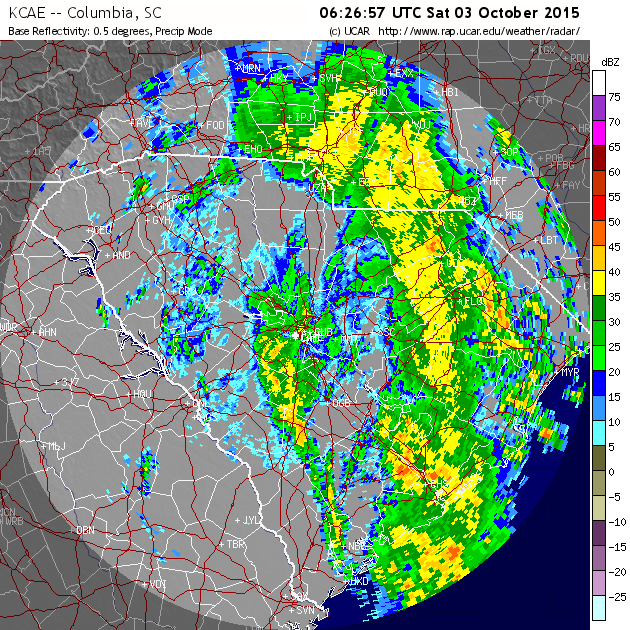
Radar summary,  mid-afternoon  Oct. 15, 2015

October 15, 2015lakehughesmudflow
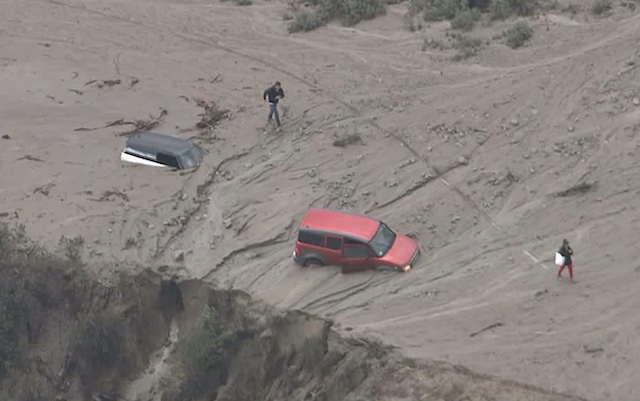
Oct. 15, 2015 Los Angeles County flash flood.   (Photo via KTLA)

from Chapter V in El Niño:  The WILD side of the weather cycle…

“California responds to any tropical inundation pretty quickly and dramatically. So, watch California! When their streets become rivers and their desert bridges begin to wash out, it may be time to start filling the sandbags. Bad weather that begins in California will not end there, it will spread to other parts of the country.”

Learn more in my latest e-book El Niño:  The WILD side of the weather cycle…
What we know, what we don’t, and WHY you should care!

Cover2

Available at Amazon

Wild Bill

Fall Color time, Cold pattern, New Book Cover

October 15, 2015

Fall Color time

A quick pause to make note of a special weekend, the middle of October, fall foliage time for a healthy portion of the nation.  Clouds, wind, and snow flurries across portions of New England should not discourage your pursuit of the perfect picture.

franconia notch, NH - 1

Cold pattern for much of the east for the upcoming weekend.

The two “H’s” over Minnesota and over Illinois guarantee a sparkling weekend for many.

October 15, 2015 northamerica66hrsatur18z

Anomalies in 3.4 Niño region grew from 1.7°C in July, top left, to 2.4°C in October, bottom left. Left chart is graphic representation of that increase.  Then compare left to right, similar but simpler than the chart in chapter 1 of the book, El Niño warming 2015 left, La Niña cooling 2010 to the right.

El Niño warming  29.1°C actual,  + 2.4°C anomaly,  La Niña cooling  24.8°C actual, -1.9°C  anomaly.  The difference is 4.3°C or 7.74°F almost 8°F, or 85°F water compared to 77°F.

October 10, 2015bookcovercompare - Copy

The current anomaly is +2.4°C or 4.3°F.  The area of unusually warm water stretches for thousands of miles across the Pacific east of the dateline.  This is what all the excitement is about.  The warmest ocean water having changed its global position, changes weather patterns especially for the northern hemisphere winter season.

Learn more in my latest e-book El Niño:  The WILD side of the weather cycle…
What we know, what we don’t, and WHY you should care!

E-Book update:

Look for my New cover and updated ONI & EQSOI charts which show the progress of the equatorial warming associated with this year’s El Niño.

Cover2

Available at Amazon

Wild Bill

1997 had a warm early October, a little warmer than this year.

October 13, 2015

1997 had a warm early October, a little warmer than this year.

16SEP2015      29.0   2.3                           17SEP1997     28.9   2.2
23SEP2015      29.0   2.3                           24SEP1997     28.9   2.2
30SEP2015      29.1   2.4                           01OCT1997    29.1   2.4

07OCT2015      29.1   2.4                           08OCT1997   29.2    2.6

No increase in water temperature, no change in the anomaly during the past week in the 3.4 Niño region.  1997 had an early October surge, 28.9°C to 29.2, so 1997 has the edge for the moment.  2015 so far has shown no such surge in October but trails 1997 by only one tenth of a degree in measured temp 29.1 to 29.2°C.

Despite this little weekly set back, concern about this upcoming event continues to grow, especially for California.

Bill Patzert, a climatologist at NASA’s Jet Propulsion Laboratory in Pasadena California, recently said, “This is as close as you’re going to get to a sure thing.” This El Niño, he said, is “too big to fail”.  Strong words from a government scientist that usually stresses caution and discourages over reaction.

He is speaking to the California media, trying to assure them rain is in deed on the way.  But with that rain, so desperately needed for drought relief, will also come floods and mud slides.

Learn more in my latest e-book El Niño:  The WILD side of the weather cycle…
What we know, what we don’t, and WHY you should care!

Cover2


Available at Amazon

Wild Bill

South Carolina rainfall update, Forecast model inconsistence,

October 11, 2015

South Carolina rainfall update,

South Carolina rainfall on Saturday October 10, 2015.  Radar estimates reach over 4 inches in areas west of Columbia.  Several Flash Flood Warnings were issued less than a week after last weekend’s catastrophic event.

October 11, 2015 rainthunderlightningSouthCarolina0614zJPG - Copy

Forecast model inconsistence,

Another look at the same three days we have been looking at, namely next Saturday, Sunday, Monday,  the 17th, 18, and 19th, basically next weekend.  Strangely, moisture approaching Northern California but not from any tropical influence like we saw in yesterday’s model run.  Nora remains deep in the tropics far away from California.  It is really not unusual to have large differences from run to run.  The Nora forecast is a pretty big change.  However, even with the Nora change, the model still engineers significant moisture into Northern California.  In this run, that is weak Nora in between Hawaii and the soon to develop Olaf.  Next weekend still looks interesting for at least Northern California, that is at least some green hanging around.

GFS 18z run 162 hour forecast for Saturday October 17, 2015  12zOctober 10, 2015 pacificforecast162hr

If this forecast actually verified it would be a very welcome wet October weekend in parts of California.

GFS 18z run 186 hour forecast for Sunday October 18, 2015  12zOctober 10, 2015 pacificforecast186hr

From the Blog several days ago, “GFS model for the Pacific at 300 hours or about 12 days out shows a 960mb low”.  This was on the 7th so, a 12 day forecast would be around Monday the 19th.  so, ….

The 18z run shows a rather small unimpressive 982mb low for early Monday the 19th.

GFS 18z run 210 hour forecast for Monday October 19, 2015  12zOctober 10, 2015 pacificforecast210hr

Where as the 00z run shows a large rather impressive 956mb low for early Monday the 19th.

GFS 00z run 204 hour forecast for Monday October 19, 2015  12zOctober 10, 2015 pacificforecast204hr

This is just different runs of the same model.  Forecasters have several models to choose from, all run several times a day.  Weather forecasting has its challenges.  The one clue consistent to all four days we have looked at is this “960mb” low lurking somewhere west of Washington State on Monday the 19th.

These runs also lost interest in anything too serious in the Gulf of Mexico.  Although still an area to watch, big high to north, old front, moisture gathering, definitely  a tropical breeding ground.

The next big test for the 2015 El Niño comes Monday when the next round of weekly anomaly numbers are released.  1997 jumps two tenths in the coming week, will 2015 keep pace?

16SEP2015      29.0   2.3                           17SEP1997     28.9   2.2
23SEP2015      29.0   2.3                           24SEP1997     28.9   2.2
30SEP2015      29.1   2.4                           01OCT1997    29.1   2.4

07OCT2015   Monday                               08OCT1997   29.2    2.6

Learn more in my latest e-book El Niño:  The WILD side of the weather cycle…
What we know, What we don’t, and Why you should care!

Cover2


Available at Amazon

Wild Bill

More rain more dam worries in South Carolina

October 10,  2015

The serious flooding in South Carolina began to get much worse during the day last Saturday.  Look at Saturday morning one week later.October 10, 2015 thunderlightningSouthCarolina1055z - Copy

The system is moving quickly so no repeat of last weekend. But still thunder and lightning and downpours to begin the weekend.

Learn more in my latest e-book El Niño:  The WILD side of the weather cycle… What we know, What we don’t, and Why you  should care!

Available at Amazon

Wild Bill

A little hung up on what is next.

October 10, 2015 A little hung up on what is next.

The South Carolina disaster hit a little close to home.  I feel like I need watch all this a little more closely.  Which by the way is really the theme of my new e-book.  You have got to watch and be aware.

In my latest e-book El Niño: The WILD side of the weather cycle… I expressed my opinion that a specific weather forecast beyond 4 or 5 days tends to become climatology.  What is considered “normal” for that location and time of year.  But our current running GFS model, the Global Forecasting System, produces solutions out to 15 days.

So, in the spirit of “what could possibly be next”, let us run that GFS model and see what we find.  Last blog I left you with this forecast panel of the pacific.

GFS model for the Pacific at 300 hours or about 12 days out shows a 960mb low.  This was on the 7th so, a 12 day forecast would be around Monday the 19th.

We are looking at a 960mb low Monday the 19th somewhere west of Washington State.

October 08, 2015 pacific10dayforecast - Copy

Yes, another tropical system in the East Pacific forecast to become a hurricane.

October 09, 2015 depression13track

One run of the GFS today thinks next Sunday the remnants of this system will be west of Santa Maria headed into California.  Not the end of the world, the system looks quite small.  But after Joaquin last weekend and Hurricane Oho spinning past Hawaii this week, how could there even be the possibility of another tropical system affecting the U.S.?

It is just one model run.  There are 4 in a day and it is over a week away.  In South Carolina a week changed the landscape.  But like in a novel, you must suspend the disbelief.

GFS 18z run 210 hour forecast for Sunday October 18, 2015 12z

October 09, 2015 pacificforecast196hr - Copytwo

In the next six panels, the model takes the remnants of what will become Hurricane Nora, and swings her right up to California and into San Francisco Bay area by late Sunday.

And yes by panel 6th panel we are at Monday morning October 19.  Moisture from Nora still in California, and only a 964mb low west of Washington State.  We start all this with the snapshot of a 960 pacific low.  Also the disturbance in the Gulf of Mexico depicted the model 2 days ago appears to be alive and well.

Go to full screen and increase your page size to 200 for the best view of the graphs below.

GFS 18z run 174 and 186 hour forecast for Saturday October 17, 2015 00z and 12zOctober 09, 2015 pacificforecast174hr - Copy

GFS 18z run 198 and 210 hour forecast for Sunday October 18, 2015 00z and 12zOctober 09, 2015 pacificforecast196hr - Copy

GFS 18z run 222 and 234 hour forecast for Monday October 19, 2015 00z and 12zOctober 09, 2015 pacificforecast222hr - Copy

So, if this weekend is quiet and pleasant where you are enjoy!   Tropical activity in the Eastern Pacific is a sign El Niño is alive and well, and that means more amazing weather is just days away.

Learn more in my latest e-book El Niño:  The WILD side of the weather cycle…
What we know, What we don’t, and Why you should care!

Available at Amazon

Wild Bill

Another Hurricane, fortunately another miss for Hawaii.


October 08, 2015   Another Hurricane, and yet another miss for Hawaii.  There have been a number of storms that have been in the vicinity of the Hawaiian Islands this season, but none so far, have had the impact that the one tropical storm had last year.  But with our current El Niño in full swing, warming the waters of the Central and Eastern Pacific, the threat to Hawaii from tropical systems will continue well into November.

October 07, 2015 pacifichurricane0600z - Copy

Water vapor picture of Hurricane Oho from early Wednesday morning.  The Advisory  is from Wednesday afternoon.

Hurricane Oho Advisory Number 020
Issued at 500 PM HST WED OCT 07 2015
SUMMARY OF 500 PM HST…0300 UTC…INFORMATION
———————————————-
Location: 30.5N 144.5W
ABOUT 995 MI…1605 KM NE OF HILO HAWAII
ABOUT 1045 MI…1685 KM NE OF HONOLULU HAWAII
Maximum sustained winds: 85 MPH…140 KM/H
Present movement: NNE or 20 degrees AT 41 MPH…67 KM/H
Minimum central pressure: 968 MB…28.59 INCHES

A tropical forecast track you just do not see every day.  A system expected to retain tropical storm strength and status to near to near 40 degrees north latitude.  That is pretty far north for our West Coast. And a tractable post-tropical storm to the coast of British Columbia late Thursday early Friday.

October 07, 2015HurricaneOhoforecasttrack

The little purple dot, center image east northeast of Hawaii is the hurricane.  The advisory has the storm moving NNE at 41 mph.  Image below is only 18 hours after image above, notice Hawaiian Islands are left far behind.

October 07, 2015eastpacificwv2345z

The storm is really moving, already passing west of Washington state late in the day on Thursday October 8th.

October 07, 2015forecastpanel30hr

Finally, a quick tease illustrating that the long cool weather season has begun. There will be something to watch just about every day from now until spring.

GFS model for the Pacific at 300 hours or about 12 days out shows a 960mb low, similar to a Category 2 hurricane, some 600 miles from the Pacific Northwest.  So, there is a possibility for two strong remnant tropical systems near the Pacific Northwest in less than two weeks. The purple dot near the tip of Cuba could become an interesting feature for Florida.  Positive note: in this snap shot, most the United States actually pretty quiet.

October 08, 2015 pacific10dayforecast - Copy

The clean up and recovery has not even begun in South Carolina and new concerns are already on the distant horizon.  Welcome to El Niño.

Learn more in my latest e-book El Niño:  The WILD side of the weather cycle…
What we know, What we don’t, and Why you should care!

Available at Amazon

Wild Bill


Hurricane moves away, but still a 1000 year flood

October 06, 2015 – Hurricane moves away, but still a 1000 year flood

Below are some of the highest rainfall amounts in Charleston County, South Carolina from the recent storm. These are four day amounts, Friday Oct. 2 thru Monday Oct. 5.  There is no landform that can absorb 26 inches of rain in less than 4 days. That is nearly 6 months of rain in 4 days.

CHARLESTON COUNTY…

6 NE MOUNT PLEASANT  26.88  10/05 COCORAHS

3 ESE CAINHOY                    25.50  10/05 STORM TOTAL

3 SSW SHADOWMOSS      24.10  10/05 NWS EMPLOYEE

5 SSE CHARLESTON          23.61  10/05 COCORAHS

3 SW FOLLY BEACH            21.45 10/05 COCORAHS

This was the last image on my last blog early Saturday showing the rain in progress across  The Palmetto State .

October 03, 2015 Joaquin hurradarchs0626z

The deluge continued into Saturday across mainly South Carolina.  Regional radar and water vapor imagery show the narrow channel of moisture  from the hurricane to South Carolina .

October 03, 2015 Joaquinhurricane0940z - Copy2

With both the Perfect Storm of October 1991, and the record Maine flood of October 1996, it was dying and decaying tropical systems that kicked in the excess moisture.

Water vapor image from midday Saturday showing a rare eye from Joaquin when the storm was near its strongest point.  The image was taken around the same time Air Force reconnaissance  survived a gust to 144 knots which is about 165 mph. The Hurricane Center briefly lifted top winds on the hurricane to 155 mph, just under Category 5 status.

October 03, 2015 Joaquinhurricane1840z

MAX FL WIND 144 KT 148 / 14 NM 14:46:30Z

Maximum Flight Level Wind 144 Knots from 148 degrees or SSE, the observation occurred 14 nautical miles from the center of Joaquin at 14:46z or 10:36 AM EST  Saturday morning.

Again 144 knots is about 165 mph, all this from a VORTEX DATA MESSAGE sent by Air Force reconnaissance.  The entire message below includes a description of the ride into the storm and what they found when they got there,  Moderate turbulence inbound. Clear above in Center.

URNT12 KNHC 031523
VORTEX DATA MESSAGE   AL112015
A. 03/14:51:00Z
B. 25 deg 51 min N
071 deg 48 min W
C. 700 mb 2523 m
D. 138 kt
E. 147 deg 15 nm
F. 233 deg 144 kt
G. 148 deg 14 nm
H. EXTRAP 934 mb
I. 13 C / 3044 m
J. 17 C / 3046 m
K. NA / NA
L. Closed
M. C20
N. 12345 / 7
O. 0.02 / 1.5 nm
P. AF304 1311A JOAQUIN            OB 18
MAX FL WIND 144 KT 148 / 14 NM 14:46:30Z
SLP EXTRAP FROM 700 MB
MAX FL TEMP 23 C 313 / 9 NM FROM FL CNTR
Eye sonde failed.  Moderate turbulence inbound.  Clear above in Center.

The rain Friday into Saturday was already creating a disaster, but the rain continued, and it continued across the same South Carolina counties thru Saturday, Saturday night and into Sunday.  Hurricane Joaquin traveled hundreds of miles and the moisture channel just pivoted with the storm never losing its connection to South Carolina.

Saturday morning                                                                  Sunday morning

October 03, 2015 Joaquinhurricane2040z - Copy

The hurricane actually did just move away.  This is quite miraculous considering what some of the model forecasts were doing with a possible landfall.

So,  a unique event to be sure, we were fortunate the hurricane itself stayed far from the United States.  South Carolina did NOT get another Hugo.  But still got nailed with what is being called a “1000 year” event.  An event of this magnitude is expected once every 1000 years.

El Niño is still alive and well in early October, the most recent weekly region 3.4 anomalies are running dead even with 1997.  So, this El Niño thing is happening, we gotta be on guard.  The Joaquin situation evolved very quickly.  It really could have been any where along the coast.  So, who’s going to be next?  When is the next 1000 year flood?

01OCT1997      29.1C    2.4C

30SEP2015      29.1C     2.4C

More on these warm anomalies later this week.

Welcome to El Niño.

Learn more in my latest e-book El Niño:  The WILD side of the weather cycle…
What we know, What we don’t, and Why you should care!

Available at Amazon

Wild Bill

No Hurricane, but still heavy rain!


No Hurricane, but still heavy rain!

The spaghetti chart is one of the better illustrations currently of the major hurricane threat going out to sea. So, no land falling Hurricane for the East Coast this weekend.  It’s kind of  amazing that it was even a possibility.  But we looked at three model runs over three different days that brought distinct areas of low pressure westward into the U.S.

October 03, 2015 Joaquin hurrspaghetti0600z

But in the four days we have discussed this storm system it really has not gone anywhere except into the Central Bahamas for an extended stay.   Overnight positions over the last four nights show a southwest small loop into the Bahamas and then back out.  Overall the satellite picture below looks pretty similar to the last several nights.   A red blob well east southeast of Miami.

September 30  200 AM EDT…0600 UTC….25.5N 72.0W

October      01   200 AM EDT…0600 UTC …23.5N 73.4W

October      02   200 AM EDT…0600 UTC… 23.0N 74.7W

October      02   200 AM EDT…0600 UTC…24.8N 73.7W

October 03, 2015 Joaquin hurrsatelliteir0600z

The following pictures are water vapor images, they show where the rich moisture is in contrast to the drier air.   The story at the moment is the trail of moisture from Joaquin northward to the Carolinas.  The Hurricane is 500 miles away and moving away, but its moisture is still causing serious problems. This is an example of what is called “transitional season high amplitude flow”, spring or autumn weather patterns with blocking ridges and cut off lows.  These types of patterns are the most difficult for forecasters and forecast models.

October 03, 2015 Joaquin hurrsatellitevapor0600z

Shown for comparison to water vapor image above and pic in yesterdays blog taken at the same time of day.

October 03, 2015 Joaquin hurrsatellitevaportwo0632z

Columbia South Carolina radar showing what is going on under the bright white clouds.

October 03, 2015 Joaquin hurradarchs0626z

Wild Bill

A BIG sigh of relief…Still some questions

October 02, 2015 Friday

A BIG sigh of relief…Still some questions

Now all of a sudden,  track forecasts for Joaquin are trending not only off shore,  but well off shore.  So, overall a much brighter outlook for the weekend for the Eastern Seaboard, although still a few issues.  Joaquin is a large, strong storm and will be pushing against a large high pressure system over Eastern Canada.

Let us look at the same products we have viewed in recent days and track the progress of our system.  First, the Hurricane Center track is now well offshore.October 02, 2015 Joaquin hurrtracki0600z

Now the forecast for Sunday morning from the GFS, looks much like yesterdays run with the Hurricane well east of North Carolina.

October 02, 2015 Joaquinforecast60hrs00zruniGFSsun12z

Here the forecast for Sunday morning from the 00Z NAM and there is our storm just a few miles from Savannah.  So, not all operational models are on board with the out to sea idea.   And over three days the Sunday morning position of our Hurricane has swung from Southeast Virginia to Southern New Jersey to a position closer to Bermuda.

October 02, 2015 Joaquinforecast60hrs00zruniNAMsun12z

So, with all that has gone on with this storm in the last 3 or 4 days , I suspect there may still be a wrinkle or two before this is completely over.  Also notice in the pic below the storm really has not gone very far in the last 48 hours.  It is still in the Bahamas southeast of Miami.  I have worked with this stuff for years and it still amazes me. The storm itself has barely moved, but the forecast positions have drifted literally hundreds of miles.

October 02, 2015 Joaquin hurrsatellitei0600z

The water vapor channel overnight clearly shows the Sandy-like  upper disturbance that has developed over Alabama and Georgia.  It is the development and evolution of this particular feature that has made and may continue to make the forecast so difficult and changeable.

October 02, 2015east_wv0700conus

We will end with a positive chart, the spaghetti plots are currently mainly well offshore.

October 02, 2015 Joaquin hurrspaghetti0600z


Stay tuned.

Wild Bill