From 70 to 120 mph in less than 24 hours

October 01, 2015  Forecast concerns jump from a possible tropical storm offshore to a Category 4 Hurricane in just 48 hours .  Despite a relatively slow season so far, all of a sudden a rather important weekend ahead.

At 5AM EST Sept. 30  Tropical Storm at 70 mph, and 988mb.

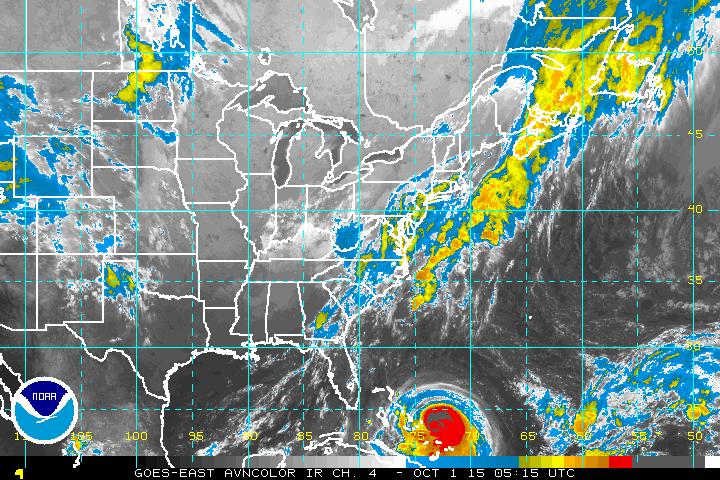
At 2AM EST Oct. 1st  CAT 3 Hurricane at 120 mph, and 948mb

The storm has become 50 mph stronger and the pressure has dropped to 948mb, it was as high as 988mb  late Tuesday night, that’s down 40mb in less than 24 hours.

This is a perfect example of why tropical systems are so respected, and why we pay to have a National Hurricane Center.

Joaquin now a much stronger storm with much bigger consequences.  The closer it tracks to the coast the greater the impact, And look at the forecast now, …

INIT  01/0300Z 23.8N  73.1W  100 KT 115 MPH
12H  01/1200Z 23.5N  73.8W  110 KT 125 MPH
24H  02/0000Z 23.6N  74.5W  120 KT 140 MPH
36H  02/1200Z 24.7N  74.8W  120 KT 140 MPH
48H  03/0000Z 26.6N  74.7W  110 KT 125 MPH
72H  04/0000Z 31.6N  74.7W   95 KT 110 MPH
96H  05/0000Z 36.2N  75.6W   85 KT 100 MPH
120H 06/0000Z 38.5N  76.5W   55 KT  65 MPH

October 01, 2015 Joaquin hurrtracki0600z

October 01, 2015 Joaquin hurrtracki0900z

The Hurricane Center forecast finally comes back toward the coast, and of course the model that has been so onshore with its track, now runs more parallel along the Delmarva and Jersey coast .  Tonight the forecast track looks more like a stronger Irene than a hooking Sandy. Below, most recent Sunday morning forecast showing Joaquin well offshore and headed north,  below that,  Sunday morning forecast 6 hours before  showing Joaquin settling into Southeast Virginia.  So this is still a developing situation, everybody needs to watch from the Carolinas up through New England, and be ready to act. Life threatening conditions may be experienced  as early as late Saturday along the Outer Banks of North Carolina..

October 01, 2015 Joaquinforecast84hrs00zruni0600z

Forecast for Sunday morning, 12z is 8 AM EDT, above 00z run Oct. 1, below 18z run Sept.30.  Consecutive runs 6 hours apart, different solutions.

October 01, 2015 Joaquinforecast90hrs18zruni0600z

The storm is much stronger,  but fortunately has not moved much yet. It s really not far from where it was last night.

October 01, 2015 Joaquin hurrsatellitei0600z

Spaghetti models still appear to be hanging on to the hook in this chart  But these update every 3 to 6 hours depending on the model.  So some change is likely in this product as well as time passes.

October 01, 2015 Joaquin hurrspaghetti0600z

This is probably the biggest tropical weather forecast for the Middle Atlantic Coast and New England since Sandy.  So the drama associated with this event is just beginning.

Last recon currently posted is 948mb,  just for comparison in 2012 Sandy was 946mb at landfall.   Irene was 951mb in 2011 when it first reaches North Carolina . Both Irene and Sandy were very costly storms, the fact we can make these comparisons shows the gravity of the situation.  But Joaquin is forecast to get even stronger, so much more in the days ahead as we watch to see what happens to the East Coast.


Wild Bill.


close to an exact match

September 29, 2015

close to an exact match

Here is a quick side by side comparison of weekly SST anomalies in the El Niño 3.4 region
for the last three months. This year 2015 to the left, 1997 to the right.
01JUL2015      28.9 1.4            02JUL1997     29.0 1.5
08JUL2015      28.8 1.5            09JUL1997     28.9 1.6
15JUL2015      28.9 1.7            16JUL1997     29.0 1.8
22JUL2015      28.8 1.6            23JUL1997     28.8 1.7
29JUL2015      28.8 1.7            30JUL1997     28.9 1.9

05AUG2015      28.9 1.9            06AUG1997     28.8 1.8
12AUG2015      28.9 2.0            13AUG1997     28.9 2.0
19AUG2015      28.9 2.1            20AUG1997     28.9 2.1
26AUG2015      29.0 2.2            27AUG1997     28.8 2.0

02SEP2015      28.9 2.1            03SEP1997     28.9 2.1
09SEP2015      29.0 2.3            10SEP1997     28.9 2.2
16SEP2015      29.0 2.3            17SEP1997     28.9 2.2
23SEP2015      29.0 2.3            24SEP1997     28.9 2.2
There is no more than 2 tenths of a degree difference in any week over the last 13 weeks.
When it comes to scientific comparison this may be as close to an exact match as you will ever see.
As we discussed in El Niño, The Wild side of the Weather Cycle, an experience similar to 1997, is going to have its disadvantages. The 1997-98 El Niño was the strongest and had impacts around the world.

Active weather continues in late September with flooding rains in Southern Alabama and the Florida Panhandle. Heavy rain becomes a threat for the East coast, and especially the Northeast as a series of events including a tropical storm line up to bother The East in the final days of September.

The need to stay alert and understand the threats for active weather is already increasing due to the prominence of the current El Niño.

Wild Bill

apparent source of the moisture

As I continue to ponder the fate of the 7 Utah hikers in Zion National Park, the apparent source of the moisture is an interesting subject.  Enhanced tropical moisture drifted into the Southwest U.S. from a remnant tropical system, former Hurricane Linda, on Monday September 14th.  Record September rains occurred in California and flash floods caused fatalities in Arizona and Utah.

Interesting calendar day to be reflecting on tropical moisture and the Desert Southwest.  Reviewing the San Diego NWS homepage today,  September 26th, I found past weather telling a similar story, life threating flash floods because of tropical rains.

September 26, 1997: Heavy rain and thunderstorms developed on Sept. 24 and ended on this day. That moisture came from the remnants of Hurricane Nora.

September 26, 1982: The remnants of Hurricane Olivia re-curved northeastward across Southern California.

So the remnants of Hurricane Nora in 1997,  and the remnants of Hurricane Olivia in 1982, both from infamous years from my new e-book.

And now we have the remnants of Hurricane Linda in 2015.

The book is written, but the journey is just beginning, …

Welcome to El Niño.

Learn more in my latest e-book El Niño:  The WILD side of the weather cycle…
What we know, What we don’t, and Why you should care!

Available at Amazon

Wild Bill

Zion Canyon flash flood

I am troubled by a recent occurrence. Two of my favorite things, eventful weather and National Parks, have managed to intertwine in a bizarre, unsettling and tragic way.  My experiences pull me in opposite directions.  On a tightly scheduled vacation with friends or family,  I can safely say,  a 40 percent chance of showers would probably not prompt changes to the daily plan.   On the other hand, one brief exposure to the slot canyons of Zion Canyon, even on a dry, safe summer day had me thinking, “this is one scary place!”.  The primary canyon of the Park is narrow enough. But deeper in, sheer walls that tower 2000 feet high narrow to just a few feet wide. These are Slot canyons, like a coin slot, very, very thin.  You would not want to be at the bottom of this narrow, water scoured channel if there were any runoff at all.  Oh no,  is that a dark cloud?  At the bottom of those canyons very little sky is visible. Much greater minds than mine have wrestled with National Park policy.  The delicate balance between public safety and unrestricted access to our nations wildest lands is always a challenge.   I am not sure anything should change. But after 25 years of jumping for every Flash Flood Warning in a client’s listening area, 7 fatalities at such a place of awe and adventure, seems an awfully high price to pay for a day in the wild.   How did all the safety measures fail in this particular situation?

More thoughts next time

Wild Bill


the anomalies continue to grow


17SEP1997       28.9C   2.2C

16SEP2015       29.0C   2.3C

For a brief moment in mid-September 2015 the weekly SST anomalies in the 3.4 region actually exceeded the value of the record 1997 season.   1997 had a slight lead most weeks of late August and early September, so 2015 currently lags behind 1997 in the 3 month averages and the ONI.  The next several weeks will be quite interesting to see if this year can continue to warm at the 1997 rate.

Watch for more unusual weather events as the anomalies warm.

Wild Bill